Best Buy 2013 Annual Report Download - page 90
Download and view the complete annual report
Please find page 90 of the 2013 Best Buy annual report below. You can navigate through the pages in the report by either clicking on the pages listed below, or by using the keyword search tool below to find specific information within the annual report.-
 1
1 -
2
-
3
-
4
-
5
-
6
-
7
-
8
-
9
-
10
-
11
-
12
-
13
-
14
-
15
-
16
-
17
-
18
-
19
-
20
-
21
-
22
-
23
-
24
-
25
-
26
-
27
-
28
-
29
-
30
-
31
-
32
-
33
-
34
-
35
-
36
-
37
-
38
-
39
-
40
-
41
-
42
-
43
-
44
-
45
-
46
-
47
-
48
-
49
-
50
-
51
-
52
-
53
-
54
-
55
-
56
-
57
-
58
-
59
-
60
-
61
-
62
-
63
-
64
-
65
-
66
-
67
-
68
-
69
-
70
-
71
-
72
-
73
-
74
-
75
-
76
-
77
-
78
-
79
-
 80
80 -
 81
81 -
 82
82 -
 83
83 -
 84
84 -
 85
85 -
 86
86 -
 87
87 -
 88
88 -
 89
89 -
 90
90 -
 91
91 -
 92
92 -
 93
93 -
 94
94 -
 95
95 -
 96
96 -
 97
97 -
 98
98 -
 99
99 -
 100
100 -
101
-
102
-
103
-
104
-
105
-
106
-
107
-
108
-
109
-
110
-
111
-
112
-
113
-
114
-
115
-
116
 |
 |
90
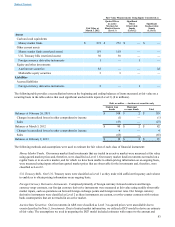
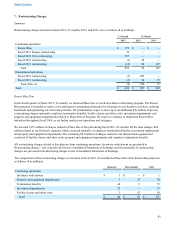
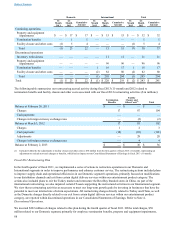
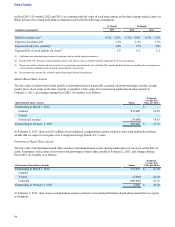
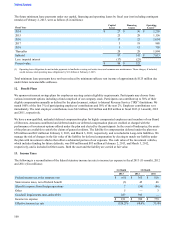
The following table summarizes our restructuring accrual activity during fiscal 2013 (11-month) and 2012 related to
termination benefits and facility closure and other costs associated with our fiscal 2011 restructuring activities ($ in millions):
Termination
Benefits
Facility
Closure and
Other Costs(1) Total
Balance at February 26, 2011 $ 28 $ 13 $ 41
Charges 11 6 17
Cash payments (33)(14)(47)
Adjustments (3) 4 1
Balance at March 3, 2012 3 9 12
Charges — — —
Cash payments (2)(8)(10)
Adjustments (1)(1)(2)
Changes in foreign currency exchange rates — — —
Balance at February 2, 2013 $ — $ — $ —
(1) Included within the facility closure and other costs adjustments is $10 million from the first quarter of fiscal 2012, representing an adjustment to exclude
non-cash charges or benefits, which had no impact on our Consolidated Statements of Earnings in fiscal 2012.
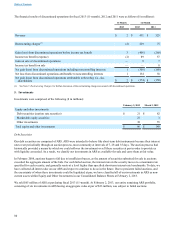
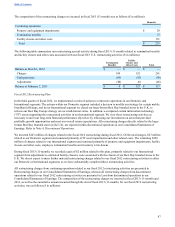
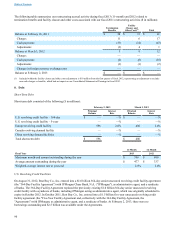
8. Debt
Short-Term Debt
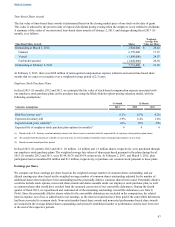
Short-term debt consisted of the following ($ in millions):
February 2, 2013 March 3, 2012
Principal
Balance Interest
Rate Principal
Balance Interest
Rate
U.S. revolving credit facility – 364-day $ — —% $ — —%
U.S. revolving credit facility – 5-year — —% — —%
Europe revolving credit facility 596 2.0% 480 2.4%
Canada revolving demand facility — —% — —%
China revolving demand facilities — —% — —%
Total short-term debt $ 596 $ 480
11-Month 12-Month
Fiscal Year 2013 2012
Maximum month-end amount outstanding during the year $ 596 $ 480
Average amount outstanding during the year $ 477 $ 337
Weighted-average interest rate at year-end 2.0% 2.4%
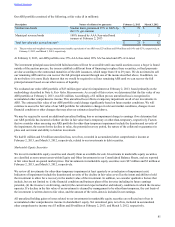
U.S. Revolving Credit Facilities
On August 31, 2012, Best Buy Co., Inc. entered into a $1.0 billion 364-day senior unsecured revolving credit facility agreement
(the "364-Day Facility Agreement") with JPMorgan Chase Bank, N.A. ("JPMorgan"), as administrative agent, and a syndicate
of banks. The 364-Day Facility Agreement replaced the previously existing $1.0 billion 364-day senior unsecured revolving
credit facility with a syndicate of banks, including JPMorgan acting as administrative agent, which was originally scheduled to
expire in October 2012. In October 2011, Best Buy Co., Inc. entered into a $1.5 billion five-year unsecured revolving credit
facility agreement (the "Five-Year Facility Agreement and, collectively with the 364-Day Facility Agreement, the
"Agreements") with JPMorgan, as administrative agent, and a syndicate of banks. At February 2, 2013, there were no
borrowings outstanding and $2.5 billion was available under the Agreements.
Table of Contents