Best Buy 2013 Annual Report Download - page 50
Download and view the complete annual report
Please find page 50 of the 2013 Best Buy annual report below. You can navigate through the pages in the report by either clicking on the pages listed below, or by using the keyword search tool below to find specific information within the annual report.-
 1
1 -
2
-
3
-
4
-
5
-
6
-
7
-
8
-
9
-
10
-
11
-
12
-
13
-
14
-
15
-
16
-
17
-
18
-
19
-
20
-
21
-
22
-
23
-
24
-
25
-
26
-
27
-
28
-
29
-
30
-
31
-
32
-
33
-
34
-
35
-
36
-
37
-
38
-
39
-
 40
40 -
 41
41 -
 42
42 -
 43
43 -
 44
44 -
 45
45 -
 46
46 -
 47
47 -
 48
48 -
 49
49 -
 50
50 -
 51
51 -
 52
52 -
 53
53 -
 54
54 -
 55
55 -
 56
56 -
 57
57 -
 58
58 -
 59
59 -
 60
60 -
61
-
62
-
63
-
64
-
65
-
66
-
67
-
68
-
69
-
70
-
71
-
72
-
73
-
74
-
75
-
76
-
77
-
78
-
79
-
80
-
81
-
82
-
83
-
84
-
85
-
86
-
87
-
88
-
89
-
90
-
91
-
92
-
93
-
94
-
95
-
96
-
97
-
98
-
99
-
100
-
101
-
102
-
103
-
104
-
105
-
106
-
107
-
108
-
109
-
110
-
111
-
112
-
113
-
114
-
115
-
116
 |
 |

50
share. Effective with the quarterly cash dividend paid in the third quarter of fiscal 2013 (11-month), we increased our quarterly
cash dividend per share by 6% to $0.17 per share. The payment of cash dividends is subject to customary legal and contractual
restrictions. During fiscal 2013 (11-month), we made four cash dividend payments totaling $0.66 per share, or $224 million in
the aggregate.
Other Financial Measures
Our debt to earnings ratio was (10.1) as of February 2, 2013, compared to 8.6 as of March 3, 2012, due primarily to a net loss
in the 12 months ended February 2, 2013, compared to net earnings in the 12 months ended March 3, 2012. Our adjusted debt
to earnings before goodwill impairment, interest, income taxes, depreciation, amortization and rent ("EBITDAR") ratio, which
includes capitalized operating lease obligations in its calculation, was 3.2 and 2.6 as of February 2, 2013 and March 3, 2012,
respectively, due primarily to decreases in net earnings, goodwill impairments, and income tax expense in the 12 months ended
February 2, 2013.
Our adjusted debt to EBITDAR ratio is considered a non-GAAP financial measure and should be considered in addition to,
rather than as a substitute for, the most directly comparable ratio determined in accordance GAAP. We have included this
information in our MD&A as we view the adjusted debt to EBITDAR ratio as an important indicator of our creditworthiness.
Furthermore, we believe that our adjusted debt to EBITDAR ratio is important for understanding our financial position and
provides meaningful additional information about our ability to service our long-term debt and other fixed obligations and to
fund our future growth. We also believe our adjusted debt to EBITDAR ratio is relevant because it enables investors to compare
our indebtedness to that of retailers who own, rather than lease, their stores. Our decision to own or lease real estate is based on
an assessment of our financial liquidity, our capital structure, our desire to own or to lease the location, the owner’s desire to
own or to lease the location, and the alternative that results in the highest return to our shareholders.
Our adjusted debt to EBITDAR ratio is calculated as follows:
Adjusted debt to EBITDAR = Adjusted debt
EBITDAR
The most directly comparable GAAP financial measure to our adjusted debt to EBITDAR ratio is our debt to net earnings ratio,
which excludes capitalized operating lease obligations from debt in the numerator of the calculation and does not adjust net
earnings in the denominator of the calculation.
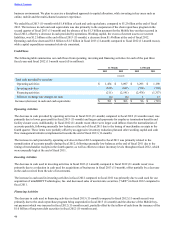
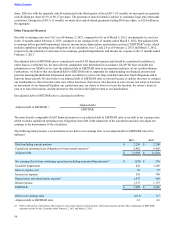
The following table presents a reconciliation of our debt to net earnings ratio to our adjusted debt to EBITDAR ratio ($ in
millions):
2013(1) 2012(1)
Debt (including current portion) $ 2,296 $ 2,208
Capitalized operating lease obligations (8 times rental expense)(2) 9,402 9,402
Adjusted debt $ 11,698 $ 11,610
Net earnings (loss) from continuing operations including noncontrolling interests(3) $(228) $ 330
Goodwill impairment 822 1,207
Interest expense, net 93 97
Income tax expense 310 709
Depreciation and amortization expense(4) 1,437 968
Rental expense 1,175 1,175
EBITDAR $ 3,609 $ 4,486
Debt to net earnings ratio (10.1) 6.7
Adjusted debt to EBITDAR ratio 3.2 2.6
(1) Debt is reflected as of the balance sheet dates for each of the respective fiscal periods, while rental expense and the other components of EBITDAR
represent activity for the 12 months ended February 2, 2013 and March 3, 2012.
Table of Contents