Ford 2013 Annual Report Download - page 13
Download and view the complete annual report
Please find page 13 of the 2013 Ford annual report below. You can navigate through the pages in the report by either clicking on the pages listed below, or by using the keyword search tool below to find specific information within the annual report.-
 1
1 -
2
-
 3
3 -
 4
4 -
 5
5 -
 6
6 -
 7
7 -
 8
8 -
 9
9 -
 10
10 -
 11
11 -
 12
12 -
 13
13 -
 14
14 -
 15
15 -
 16
16 -
 17
17 -
 18
18 -
 19
19 -
 20
20 -
 21
21 -
 22
22 -
 23
23 -
24
-
25
-
26
-
27
-
28
-
29
-
30
-
31
-
32
-
33
-
34
-
35
-
36
-
37
-
38
-
39
-
40
-
41
-
42
-
43
-
44
-
45
-
46
-
47
-
48
-
49
-
50
-
51
-
52
-
53
-
54
-
55
-
56
-
57
-
58
-
59
-
60
-
61
-
62
-
63
-
64
-
65
-
66
-
67
-
68
-
69
-
70
-
71
-
72
-
73
-
74
-
75
-
76
-
77
-
78
-
79
-
80
-
81
-
82
-
83
-
84
-
85
-
86
-
87
-
88
-
89
-
90
-
91
-
92
-
93
-
94
-
95
-
96
-
97
-
98
-
99
-
100
-
101
-
102
-
103
-
104
-
105
-
106
-
107
-
108
-
109
-
110
-
111
-
112
-
113
-
114
-
115
-
116
-
117
-
118
-
119
-
120
-
121
-
122
-
123
-
124
-
125
-
126
-
127
-
128
-
129
-
130
-
131
-
132
-
133
-
134
-
135
-
136
-
137
-
138
-
139
-
140
-
141
-
142
-
143
-
144
-
145
-
146
-
147
-
148
-
149
-
150
-
151
-
152
 |
 |
Ford Motor Company | 2013 Annual Report 11
Management’s Discussion and Analysis of Financial Condition and Results of Operations (Continued)
As a result, we analyze the profit impact of certain cost changes holding constant present-year volume and mix and
currency exchange, in order to evaluate our cost trends absent the impact of varying production and currency exchange
levels. We analyze these cost changes in the following categories:
• Material excluding commodity costs - primarily reflecting the change in cost of purchased parts used in the
assembly of our vehicles.
• Commodity costs - reflecting the change in cost for raw materials (such as steel, aluminum, and resins) used in
the manufacture of our products.
• Structural costs - reflecting the change in costs that generally do not have a directly proportionate relationship to
our production volumes, such as labor costs, including pension and health care; other costs related to the
development and manufacture of our vehicles; depreciation and amortization; and advertising and sales
promotion costs.
• Warranty and other costs - reflecting the change in cost related to warranty coverage, including product recalls
and customer satisfaction actions, as well as the change in freight and other costs related to the distribution of our
vehicles and support for the sale and distribution of parts and accessories.
While material (including commodity), freight, and warranty costs generally vary directly in proportion to production
volume, elements within our structural costs category are impacted to differing degrees by changes in production volume.
We also have varying degrees of discretion when it comes to controlling the different elements within our structural costs.
For example, depreciation and amortization expense largely is associated with prior capital spending decisions. On the
other hand, while labor costs do not vary directly with production volume, manufacturing labor costs may be impacted by
changes in volume, for example when we increase overtime, add a production shift or add personnel to support volume
increases. Other structural costs, such as advertising or engineering costs, do not necessarily have a directly
proportionate relationship to production volume. Our structural costs generally are within our discretion, although to
varying degrees, and can be adjusted over time in response to external factors.
We consider certain structural costs to be a direct investment in future growth and revenue. For example, increases
in structural costs are necessary to grow our business and improve profitability as we expand around the world, invest in
new products and technologies, respond to increasing industry sales volume, and grow our market share.
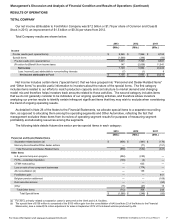
Automotive total costs and expenses for full-year 2013 was $135.2 billion. Material costs (including commodity costs)
make up the largest portion of our Automotive total costs and expenses, representing in 2013 about two-thirds of the total
amount. Of the remaining balance of our Automotive costs and expenses, the largest piece is structural costs. Although
material costs are our largest absolute cost, our margins can be affected significantly by changes in any category of costs.
Key Economic Factors and Trends Affecting the Automotive Industry
Currency Exchange Rate Volatility. The U.S. Federal Reserve has begun reducing the pace of financial asset
purchases, and the resulting shifts in capital flows have contributed to downward pressure on several emerging market
currencies. In some cases that pressure is aggravated by high inflation, unstable policy environments, or both.
Additionally, the yen has depreciated significantly over the last year as a result of policy changes by the Japanese
government and Bank of Japan. This adds significant potential downward pressure on vehicle pricing across many
markets globally. In most markets, exchange rates are market-determined, and all are impacted by many different
macroeconomic and policy factors, and thus likely to remain volatile. In some other markets, exchange rates are heavily
influenced or controlled by governments.
Excess Capacity. According to IHS Automotive, an automotive research firm, the estimated automotive industry global
production capacity for light vehicles of about 107 million units exceeded global production by about 23 million units in
2013. In North America and Europe, the two regions where the majority of industry revenue and profits are earned,
excess capacity as a percent of production in 2013 was an estimated 7% and 34%, respectively. In China, the auto
industry also witnessed excess capacity at 31% of production in 2013, as manufacturers competed to capitalize on
China’s future market potential. According to production capacity data projected by IHS Automotive, global excess
capacity conditions could continue for several years at an average of about 25 million units per year during the period
from 2014 to 2018.
For more information visit www.annualreport.ford.com