Ford 2013 Annual Report Download - page 96
Download and view the complete annual report
Please find page 96 of the 2013 Ford annual report below. You can navigate through the pages in the report by either clicking on the pages listed below, or by using the keyword search tool below to find specific information within the annual report.-
 1
1 -
2
-
3
-
4
-
5
-
6
-
7
-
8
-
9
-
10
-
11
-
12
-
13
-
14
-
15
-
16
-
17
-
18
-
19
-
20
-
21
-
22
-
23
-
24
-
25
-
26
-
27
-
28
-
29
-
30
-
31
-
32
-
33
-
34
-
35
-
36
-
37
-
38
-
39
-
40
-
41
-
42
-
43
-
44
-
45
-
46
-
47
-
48
-
49
-
50
-
51
-
52
-
53
-
54
-
55
-
56
-
57
-
58
-
59
-
60
-
61
-
62
-
63
-
64
-
65
-
66
-
67
-
68
-
69
-
70
-
71
-
72
-
73
-
74
-
75
-
76
-
77
-
78
-
79
-
80
-
81
-
82
-
83
-
84
-
85
-
 86
86 -
 87
87 -
 88
88 -
 89
89 -
 90
90 -
 91
91 -
 92
92 -
 93
93 -
 94
94 -
 95
95 -
 96
96 -
 97
97 -
 98
98 -
 99
99 -
 100
100 -
 101
101 -
 102
102 -
 103
103 -
 104
104 -
 105
105 -
 106
106 -
107
-
108
-
109
-
110
-
111
-
112
-
113
-
114
-
115
-
116
-
117
-
118
-
119
-
120
-
121
-
122
-
123
-
124
-
125
-
126
-
127
-
128
-
129
-
130
-
131
-
132
-
133
-
134
-
135
-
136
-
137
-
138
-
139
-
140
-
141
-
142
-
143
-
144
-
145
-
146
-
147
-
148
-
149
-
150
-
151
-
152
 |
 |

94 Ford Motor Company | 2013 Annual Report
FORD MOTOR COMPANY AND SUBSIDIARIES
NOTES TO THE FINANCIAL STATEMENTS
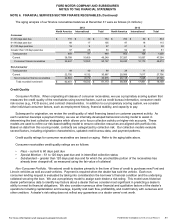
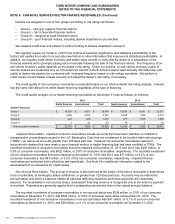
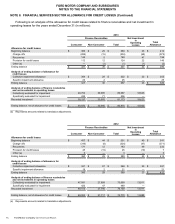
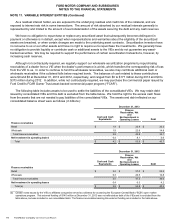
NOTE 8. FINANCIAL SERVICES SECTOR ALLOWANCE FOR CREDIT LOSSES (Continued)
Following is an analysis of the allowance for credit losses related to finance receivables and net investment in
operating leases for the years ended December 31 (in millions):
2013
Finance Receivables Net Investment
in
Operating
Leases
Consumer Non-Consumer Total
Total
Allowance
Allowance for credit losses
Beginning balance $ 360 $ 29 $ 389 $ 23 $ 412
Charge-offs (289)(15)(304)(68) (372)
Recoveries 144 5149 47 196
Provision for credit losses 112 12 124 22 146
Other (a) — (1) (1) (1) (2)
Ending balance $ 327 $ 30 $ 357 $ 23 $ 380
Analysis of ending balance of allowance for
credit losses
Collective impairment allowance $ 304 $ 28 $ 332 $ 23 $ 355
Specific impairment allowance 23 2 25 — 25
Ending balance 327 30 357 23 $ 380
Analysis of ending balance of finance receivables
and net investment in operating leases
Collectively evaluated for impairment 49,762 30,905 80,667 18,623
Specifically evaluated for impairment 435 71 506 —
Recorded investment 50,197 30,976 81,173 18,623
Ending balance, net of allowance for credit losses $ 49,870 $30,946 $80,816 $18,600
__________
(a) Represents amounts related to translation adjustments.
2012
Finance Receivables Net Investment
in
Operating
Leases
Consumer Non-Consumer Total
Total
Allowance
Allowance for credit losses
Beginning balance $ 457 $ 44 $ 501 $ 40 $ 541
Charge-offs (316) (8) (324)(47) (371)
Recoveries 171 12 183 49 232
Provision for credit losses 45 (19) 26 (19)7
Other (a) 3 — 3 — 3
Ending balance $ 360 $ 29 $ 389 $ 23 $ 412
Analysis of ending balance of allowance for
credit losses
Collective impairment allowance $ 341 $ 27 $ 368 $ 23 $ 391
Specific impairment allowance 19 2 21 — 21
Ending balance 360 29 389 23 $ 412
Analysis of ending balance of finance receivables
and net investment in operating leases
Collectively evaluated for impairment 47,991 27,699 75,690 13,911
Specifically evaluated for impairment 422 47 469 —
Recorded investment 48,413 27,746 76,159 13,911
Ending balance, net of allowance for credit losses $ 48,053 $27,717 $75,770 $13,888
__________
(a) Represents amounts related to translation adjustments.