Ford 2013 Annual Report Download - page 74
Download and view the complete annual report
Please find page 74 of the 2013 Ford annual report below. You can navigate through the pages in the report by either clicking on the pages listed below, or by using the keyword search tool below to find specific information within the annual report.-
 1
1 -
2
-
3
-
4
-
5
-
6
-
7
-
8
-
9
-
10
-
11
-
12
-
13
-
14
-
15
-
16
-
17
-
18
-
19
-
20
-
21
-
22
-
23
-
24
-
25
-
26
-
27
-
28
-
29
-
30
-
31
-
32
-
33
-
34
-
35
-
36
-
37
-
38
-
39
-
40
-
41
-
42
-
43
-
44
-
45
-
46
-
47
-
48
-
49
-
50
-
51
-
52
-
53
-
54
-
55
-
56
-
57
-
58
-
59
-
60
-
61
-
62
-
63
-
 64
64 -
 65
65 -
 66
66 -
 67
67 -
 68
68 -
 69
69 -
 70
70 -
 71
71 -
 72
72 -
 73
73 -
 74
74 -
 75
75 -
 76
76 -
 77
77 -
 78
78 -
 79
79 -
 80
80 -
 81
81 -
 82
82 -
 83
83 -
 84
84 -
85
-
86
-
87
-
88
-
89
-
90
-
91
-
92
-
93
-
94
-
95
-
96
-
97
-
98
-
99
-
100
-
101
-
102
-
103
-
104
-
105
-
106
-
107
-
108
-
109
-
110
-
111
-
112
-
113
-
114
-
115
-
116
-
117
-
118
-
119
-
120
-
121
-
122
-
123
-
124
-
125
-
126
-
127
-
128
-
129
-
130
-
131
-
132
-
133
-
134
-
135
-
136
-
137
-
138
-
139
-
140
-
141
-
142
-
143
-
144
-
145
-
146
-
147
-
148
-
149
-
150
-
151
-
152
 |
 |

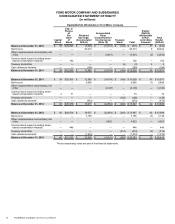
72 Ford Motor Company | 2013 Annual Report
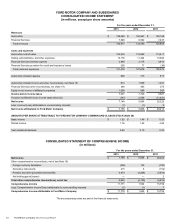
FORD MOTOR COMPANY AND SUBSIDIARIES
CONSOLIDATED STATEMENT OF EQUITY
(in millions)
Equity/(Deficit) Attributable to Ford Motor Company
Capital
Stock
Cap. in
Excess
of
Par
Value
of
Stock
Retained
Earnings/
(Accumulated
Deficit)
Accumulated
Other
Comprehensive
Income/(Loss)
(Note 18)
Treasury
Stock Total
Equity/
(Deficit)
Attributable
to Non-
controlling
Interests
Total
Equity/
(Deficit)
Balance at December 31, 2010 $ 38 $ 20,803 $ (7,038) $ (14,313) $ (163) $ (673) $ 31 $ (642)
Net income — — 20,213 — — 20,213 920,222
Other comprehensive income/(loss), net
of tax — —— (4,421) — (4,421) (2) (4,423)
Common stock issued (including share-
based compensation impacts) — 102 — —— 102 — 102
Treasury stock/other — ———(3) (3) 5 2
Cash dividends declared — — (190)—— (190) — (190)
Balance at December 31, 2011 $ 38 $ 20,905 $ 12,985 $ (18,734) $ (166) $ 15,028 $ 43 $ 15,071
Balance at December 31, 2011 $ 38 $ 20,905 $ 12,985 $ (18,734) $ (166) $ 15,028 $ 43 $ 15,071
Net income — — 5,665 — — 5,665 (1) 5,664
Other comprehensive income/(loss), net
of tax — —— (4,120) — (4,120) — (4,120)
Common stock issued (including share-
based compensation impacts) 2 71 ——— 73 — 73
Treasury stock/other — ——— (126) (126) — (126)
Cash dividends declared — — (573)—— (573) — (573)
Balance at December 31, 2012 $ 40 $ 20,976 $ 18,077 $ (22,854) $ (292) $ 15,947 $ 42 $ 15,989
Balance at December 31, 2012 $ 40 $ 20,976 $ 18,077 $ (22,854) $ (292) $ 15,947 $ 42 $ 15,989
Net income — — 7,155 — — 7,155 (7) 7,148
Other comprehensive income/(loss), net
of tax — ——4,623 — 4,623 — 4,623
Common stock issued (including share-
based compensation impacts) — 446 — —— 446 — 446
Treasury stock/other — ——— (214) (214) (2) (216)
Cash dividends declared — —(1,574) —— (1,574) — (1,574)
Balance at December 31, 2013 $ 40 $ 21,422 $ 23,658 $ (18,231) $ (506) $ 26,383 $ 33 $ 26,416
The accompanying notes are part of the financial statements.