Ford 2013 Annual Report Download - page 94
Download and view the complete annual report
Please find page 94 of the 2013 Ford annual report below. You can navigate through the pages in the report by either clicking on the pages listed below, or by using the keyword search tool below to find specific information within the annual report.-
 1
1 -
2
-
3
-
4
-
5
-
6
-
7
-
8
-
9
-
10
-
11
-
12
-
13
-
14
-
15
-
16
-
17
-
18
-
19
-
20
-
21
-
22
-
23
-
24
-
25
-
26
-
27
-
28
-
29
-
30
-
31
-
32
-
33
-
34
-
35
-
36
-
37
-
38
-
39
-
40
-
41
-
42
-
43
-
44
-
45
-
46
-
47
-
48
-
49
-
50
-
51
-
52
-
53
-
54
-
55
-
56
-
57
-
58
-
59
-
60
-
61
-
62
-
63
-
64
-
65
-
66
-
67
-
68
-
69
-
70
-
71
-
72
-
73
-
74
-
75
-
76
-
77
-
78
-
79
-
80
-
81
-
82
-
83
-
 84
84 -
 85
85 -
 86
86 -
 87
87 -
 88
88 -
 89
89 -
 90
90 -
 91
91 -
 92
92 -
 93
93 -
 94
94 -
 95
95 -
 96
96 -
 97
97 -
 98
98 -
 99
99 -
 100
100 -
 101
101 -
 102
102 -
 103
103 -
 104
104 -
105
-
106
-
107
-
108
-
109
-
110
-
111
-
112
-
113
-
114
-
115
-
116
-
117
-
118
-
119
-
120
-
121
-
122
-
123
-
124
-
125
-
126
-
127
-
128
-
129
-
130
-
131
-
132
-
133
-
134
-
135
-
136
-
137
-
138
-
139
-
140
-
141
-
142
-
143
-
144
-
145
-
146
-
147
-
148
-
149
-
150
-
151
-
152
 |
 |

92 Ford Motor Company | 2013 Annual Report
FORD MOTOR COMPANY AND SUBSIDIARIES
NOTES TO THE FINANCIAL STATEMENTS
92
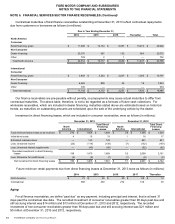
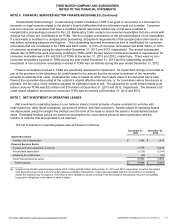
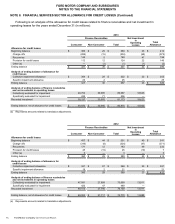
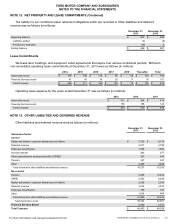
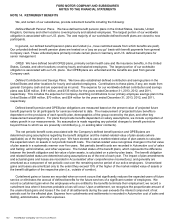
NOTE 7. NET INVESTMENT IN OPERATING LEASES (Continued)
Financial Services Sector
Operating lease depreciation expense (which includes gains and losses on disposal of assets) for the years ended
December 31 was as follows (in millions):
2013 2012 2011
Operating lease depreciation expense $ 2,411 $1,795 $ 1,140
Included in Financial Services revenues are rents on operating leases. The amounts contractually due for
minimum rentals on operating leases as of December 31, 2013 are as follows (in millions):
2014 2015 2016 2017 Thereafter Total
Minimum rentals on operating leases $ 2,618 $2,217 $1,578 $221 $ 49 $ 6,683
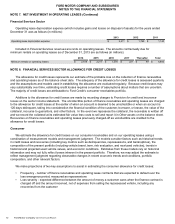
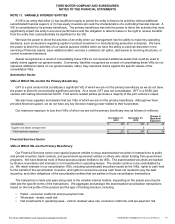
NOTE 8. FINANCIAL SERVICES SECTOR ALLOWANCE FOR CREDIT LOSSES
The allowance for credit losses represents our estimate of the probable loss on the collection of finance receivables
and operating leases as of the balance sheet date. The adequacy of the allowance for credit losses is assessed quarterly
and the assumptions and models used in establishing the allowance are evaluated regularly. Because credit losses may
vary substantially over time, estimating credit losses requires a number of assumptions about matters that are uncertain.
The majority of credit losses are attributable to Ford Credit’s consumer receivables portfolio.
Additions to the allowance for credit losses are made by recording charges to Provision for credit and insurance
losses on the sector income statement. The uncollectible portion of finance receivables and operating leases are charged
to the allowance for credit losses at the earlier of when an account is deemed to be uncollectible or when an account is
120 days delinquent, taking into consideration the financial condition of the customer, borrower, or lessee, the value of the
collateral, recourse to guarantors, and other factors. In the event we repossess the collateral, the receivable is written off
and we record the collateral at its estimated fair value less costs to sell and report it in Other assets on the balance sheet.
Recoveries on finance receivables and operating leases previously charged-off as uncollectible are credited to the
allowance for credit losses.
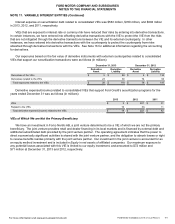
Consumer
We estimate the allowance for credit losses on our consumer receivables and on our operating leases using a
combination of measurement models and management judgment. The models consider factors such as historical trends
in credit losses and recoveries (including key metrics such as delinquencies, repossessions, and bankruptcies), the
composition of the present portfolio (including vehicle brand, term, risk evaluation, and new/used vehicles), trends in
historical and projected used vehicle values, and economic conditions. Estimates from these models rely on historical
information and may not fully reflect losses inherent in the present portfolio. Therefore, we may adjust the estimate to
reflect management judgment regarding observable changes in recent economic trends and conditions, portfolio
composition, and other relevant factors.
We make projections of two key assumptions to assist in estimating the consumer allowance for credit losses:
• Frequency - number of finance receivables and operating lease contracts that are expected to default over the
loss emergence period, measured as repossessions
• Loss severity - expected difference between the amount of money a customer owes when the finance contract is
charged off and the amount received, net of expenses from selling the repossessed vehicle, including any
recoveries from the customer