Ford 2013 Annual Report Download - page 87
Download and view the complete annual report
Please find page 87 of the 2013 Ford annual report below. You can navigate through the pages in the report by either clicking on the pages listed below, or by using the keyword search tool below to find specific information within the annual report.-
 1
1 -
2
-
3
-
4
-
5
-
6
-
7
-
8
-
9
-
10
-
11
-
12
-
13
-
14
-
15
-
16
-
17
-
18
-
19
-
20
-
21
-
22
-
23
-
24
-
25
-
26
-
27
-
28
-
29
-
30
-
31
-
32
-
33
-
34
-
35
-
36
-
37
-
38
-
39
-
40
-
41
-
42
-
43
-
44
-
45
-
46
-
47
-
48
-
49
-
50
-
51
-
52
-
53
-
54
-
55
-
56
-
57
-
58
-
59
-
60
-
61
-
62
-
63
-
64
-
65
-
66
-
67
-
68
-
69
-
70
-
71
-
72
-
73
-
74
-
75
-
76
-
 77
77 -
 78
78 -
 79
79 -
 80
80 -
 81
81 -
 82
82 -
 83
83 -
 84
84 -
 85
85 -
 86
86 -
 87
87 -
 88
88 -
 89
89 -
 90
90 -
 91
91 -
 92
92 -
 93
93 -
 94
94 -
 95
95 -
 96
96 -
 97
97 -
98
-
99
-
100
-
101
-
102
-
103
-
104
-
105
-
106
-
107
-
108
-
109
-
110
-
111
-
112
-
113
-
114
-
115
-
116
-
117
-
118
-
119
-
120
-
121
-
122
-
123
-
124
-
125
-
126
-
127
-
128
-
129
-
130
-
131
-
132
-
133
-
134
-
135
-
136
-
137
-
138
-
139
-
140
-
141
-
142
-
143
-
144
-
145
-
146
-
147
-
148
-
149
-
150
-
151
-
152
 |
 |

Ford Motor Company | 2013 Annual Report 85
FORD MOTOR COMPANY AND SUBSIDIARIES
NOTES TO THE FINANCIAL STATEMENTS
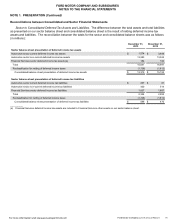
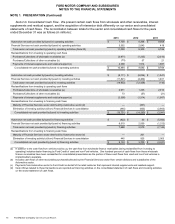
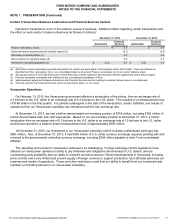
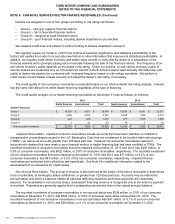
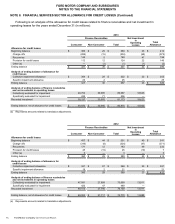
NOTE 4. FAIR VALUE MEASUREMENTS (Continued)
December 31, 2013 December 31, 2012
Level 1 Level 2 Level 3 Total Level 1 Level 2 Level 3 Total
Financial Services Sector
Assets
Cash equivalents – financial instruments
U.S. government $ — $ — $ — $ — $ 200 $ — $ — $ 200
U.S. government-sponsored enterprises — — — — — 20 — 20
Non-U.S. government — 24 — 24 — 103 —103
Corporate debt — — — — — 1—1
Total cash equivalents – financial
instruments (a) — 24 — 24 200 124 —324
Marketable securities
U.S. government 418 — — 418 620 — — 620
U.S. government-sponsored enterprises — 25 — 25 — 12 — 12
Non-U.S. government agencies — 128 — 128 — 95 — 95
Corporate debt — 1,273 —1,273 —1,155 — 1,155
Mortgage-backed and other asset-backed — 43 — 43 — 67 — 67
Non-U.S. government — 56 — 56 — 142 —142
Other liquid investments (b) — — — — — 15 — 15
Total marketable securities 418 1,525 —1,943 620 1,486 — 2,106
Derivative financial instruments
Interest rate contracts — 584 — 584 —1,291 — 1,291
Foreign currency exchange contracts — 1 — 1 — 9—9
Cross-currency interest rate swap contracts — — — — — — — —
Total derivative financial instruments (c) — 585 — 585 —1,300 — 1,300
Total assets at fair value $ 418 $ 2,134 $ — $ 2,552 $820 $2,910 $ — $ 3,730
Liabilities
Derivative financial instruments
Interest rate contracts $ — $ 305 $ — $ 305 $ — $ 256 $ — $ 256
Foreign currency exchange contracts — 25 — 25 — 8—8
Cross-currency interest rate swap contracts — 176 — 176 —117 —117
Total derivative financial instruments (c) — 506 — 506 —381 —381
Total liabilities at fair value $ — $ 506 $ — $ 506 $ — $ 381 $ — $ 381
__________
(a) Excludes time deposits, certificates of deposit, and money market accounts reported at par value on our balance sheet totaling $6.7 billion and
$6.5 billion at December 31, 2013 and 2012, respectively. In addition to these cash equivalents, we also had cash on hand totaling $2.8 billion and
$2.6 billion at December 31, 2013 and 2012, respectively.
(b) Includes certificates of deposit and time deposits subject to changes in value.
(c) See Note 16 for additional information regarding derivative financial instruments.
For more information visit www.annualreport.ford.com