Ford 2013 Annual Report Download - page 98
Download and view the complete annual report
Please find page 98 of the 2013 Ford annual report below. You can navigate through the pages in the report by either clicking on the pages listed below, or by using the keyword search tool below to find specific information within the annual report.-
 1
1 -
2
-
3
-
4
-
5
-
6
-
7
-
8
-
9
-
10
-
11
-
12
-
13
-
14
-
15
-
16
-
17
-
18
-
19
-
20
-
21
-
22
-
23
-
24
-
25
-
26
-
27
-
28
-
29
-
30
-
31
-
32
-
33
-
34
-
35
-
36
-
37
-
38
-
39
-
40
-
41
-
42
-
43
-
44
-
45
-
46
-
47
-
48
-
49
-
50
-
51
-
52
-
53
-
54
-
55
-
56
-
57
-
58
-
59
-
60
-
61
-
62
-
63
-
64
-
65
-
66
-
67
-
68
-
69
-
70
-
71
-
72
-
73
-
74
-
75
-
76
-
77
-
78
-
79
-
80
-
81
-
82
-
83
-
84
-
85
-
86
-
87
-
 88
88 -
 89
89 -
 90
90 -
 91
91 -
 92
92 -
 93
93 -
 94
94 -
 95
95 -
 96
96 -
 97
97 -
 98
98 -
 99
99 -
 100
100 -
 101
101 -
 102
102 -
 103
103 -
 104
104 -
 105
105 -
 106
106 -
 107
107 -
 108
108 -
109
-
110
-
111
-
112
-
113
-
114
-
115
-
116
-
117
-
118
-
119
-
120
-
121
-
122
-
123
-
124
-
125
-
126
-
127
-
128
-
129
-
130
-
131
-
132
-
133
-
134
-
135
-
136
-
137
-
138
-
139
-
140
-
141
-
142
-
143
-
144
-
145
-
146
-
147
-
148
-
149
-
150
-
151
-
152
 |
 |
96 Ford Motor Company | 2013 Annual Report
FORD MOTOR COMPANY AND SUBSIDIARIES
NOTES TO THE FINANCIAL STATEMENTS
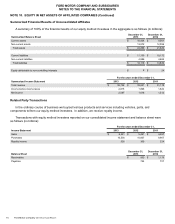
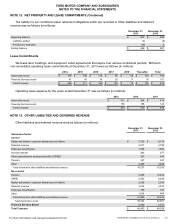
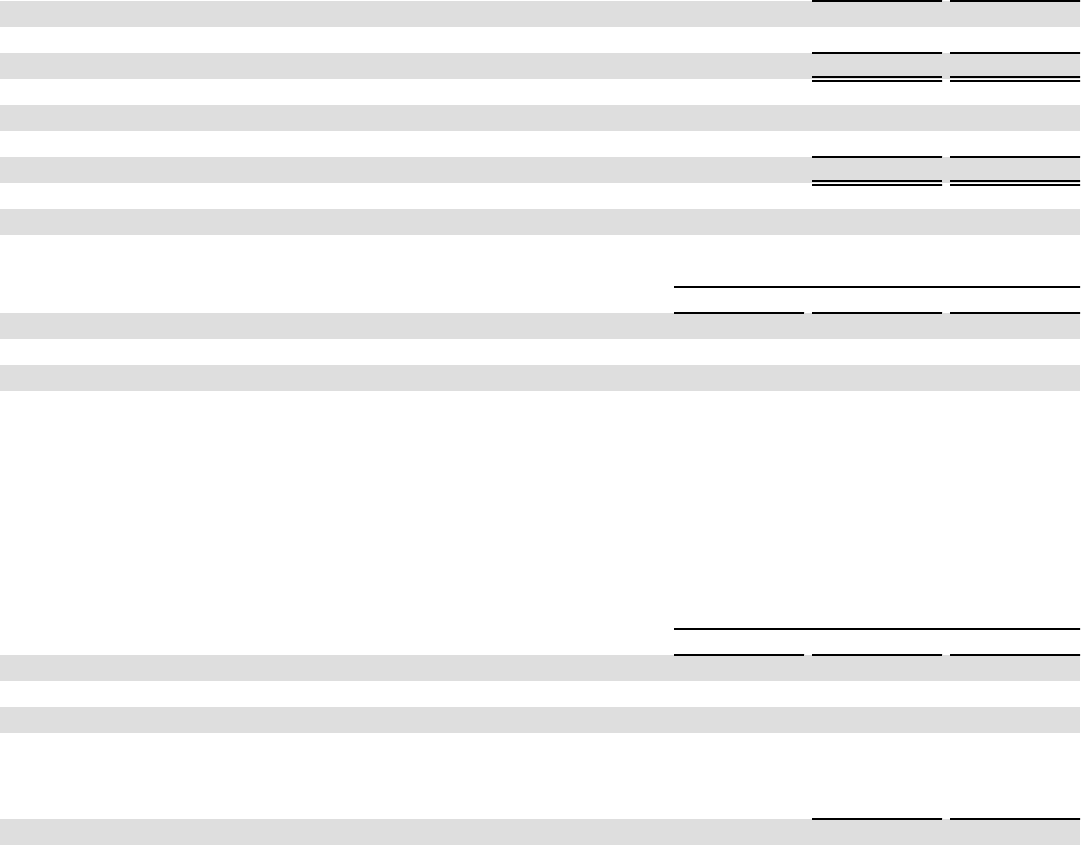
NOTE 10. EQUITY IN NET ASSETS OF AFFILIATED COMPANIES (Continued)
Summarized Financial Results of Unconsolidated Affiliates
A summary of 100% of the financial results of our equity method investees in the aggregate is as follows (in millions):
Summarized Balance Sheet
December 31,
2013
December 31,
2012
Current assets $ 10,424 $ 9,561
Non-current assets 13,872 12,059
Total assets $ 24,296 $ 21,620
Current liabilities $ 11,130 $ 10,172
Non-current liabilities 4,986 4,662
Total liabilities $ 16,116 $ 14,834
Equity attributable to non-controlling interests $ 6$ 24
For the years ended December 31,
Summarized Income Statement 2013 2012 2011
Total revenue $ 38,736 $ 33,051 $ 31,178
Income before income taxes 2,815 1,896 1,822
Net income 2,587 1,616 1,512
Related Party Transactions
In the ordinary course of business we buy/sell various products and services including vehicles, parts, and
components to/from our equity method investees. In addition, we receive royalty income.
Transactions with equity method investees reported on our consolidated income statement and balance sheet were
as follows (in millions):
For the years ended December 31,
Income Statement 2013 2012 2011
Sales $ 6,421 $5,491 $ 4,957
Purchases 10,536 10,007 9,907
Royalty income 526 369 224
Balance Sheet
December 31,
2013
December 31,
2012
Receivables $ 953 $ 1,179
Payables 724 707