Pfizer 2012 Annual Report Download - page 121
Download and view the complete annual report
Please find page 121 of the 2012 Pfizer annual report below. You can navigate through the pages in the report by either clicking on the pages listed below, or by using the keyword search tool below to find specific information within the annual report.-
 1
1 -
2
-
3
-
4
-
5
-
6
-
7
-
8
-
9
-
10
-
11
-
12
-
13
-
14
-
15
-
16
-
17
-
18
-
19
-
20
-
21
-
22
-
23
-
24
-
25
-
26
-
27
-
28
-
29
-
30
-
31
-
32
-
33
-
34
-
35
-
36
-
37
-
38
-
39
-
40
-
41
-
42
-
43
-
44
-
45
-
46
-
47
-
48
-
49
-
50
-
51
-
52
-
53
-
54
-
55
-
56
-
57
-
58
-
59
-
60
-
61
-
62
-
63
-
64
-
65
-
66
-
67
-
68
-
69
-
70
-
71
-
72
-
73
-
74
-
75
-
76
-
77
-
78
-
79
-
80
-
81
-
82
-
83
-
84
-
85
-
86
-
87
-
88
-
89
-
90
-
91
-
92
-
93
-
94
-
95
-
96
-
97
-
98
-
99
-
100
-
101
-
102
-
103
-
104
-
105
-
106
-
107
-
108
-
109
-
110
-
 111
111 -
 112
112 -
 113
113 -
 114
114 -
 115
115 -
 116
116 -
 117
117 -
 118
118 -
 119
119 -
 120
120 -
 121
121
 |
 |
Financial Summary
Pfizer Inc. and Subsidiary Companies
120
2012 Financial Report
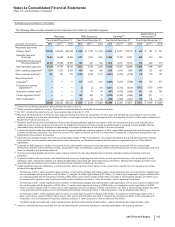
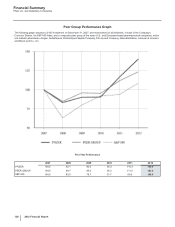
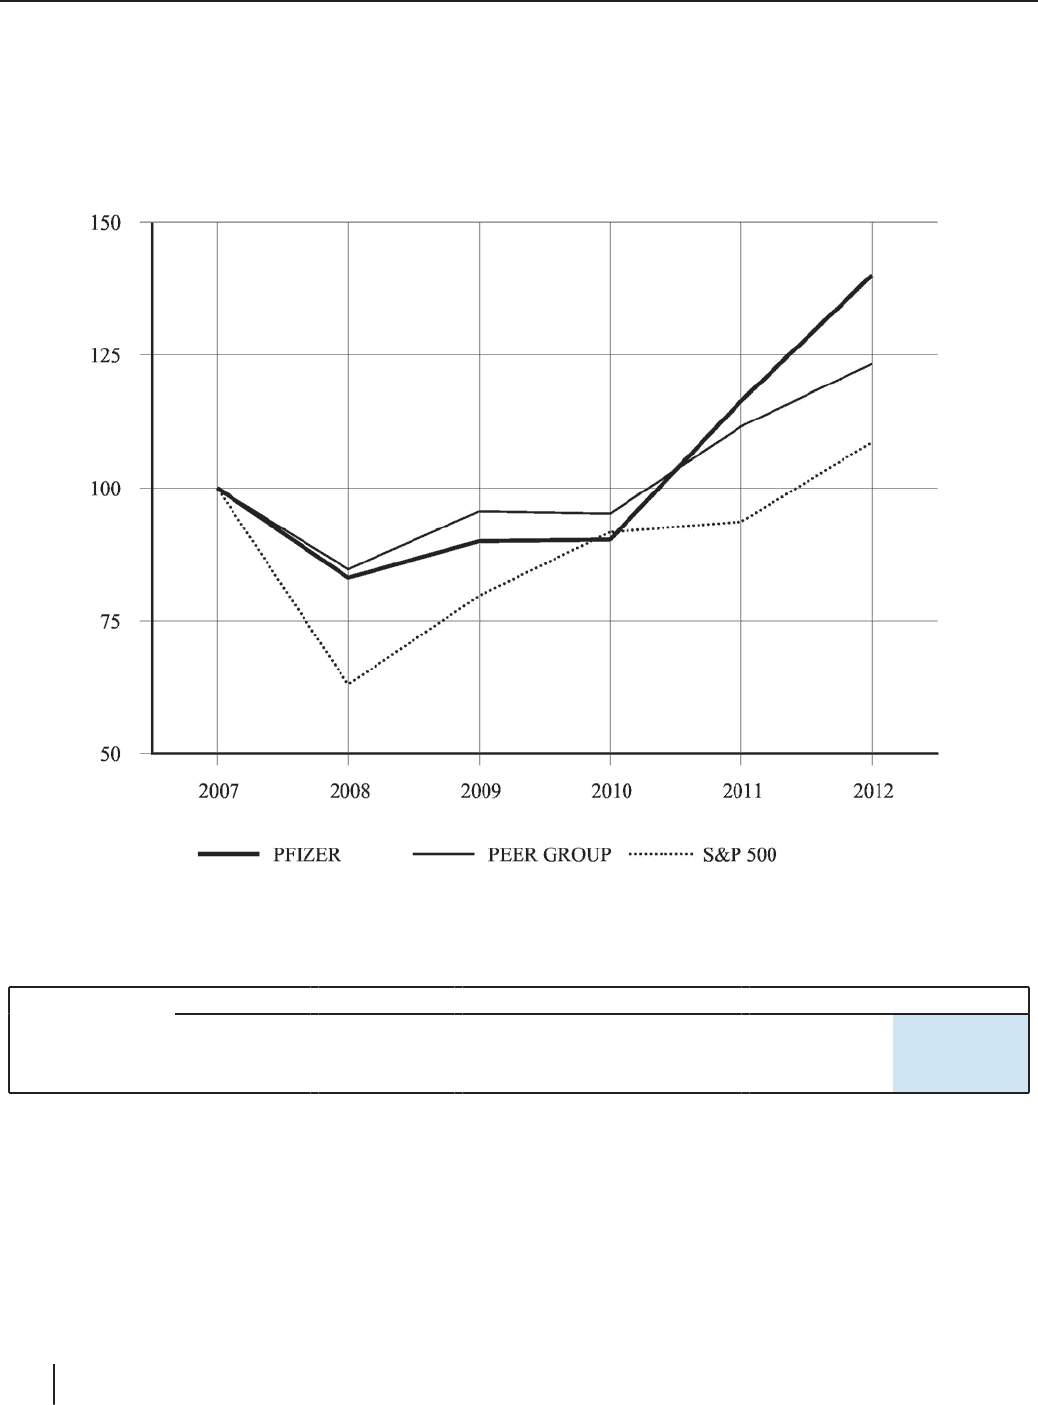
Peer Group Performance Graph
The following graph assumes a $100 investment on December 31, 2007, and reinvestment of all dividends, in each of the Company's
Common Shares, the S&P 500 Index, and a composite peer group of the major U.S.- and European-based pharmaceutical companies, which
are: Abbott Laboratories, Amgen, AstraZeneca, Bristol-Myers Squibb Company, Eli Lilly and Company, GlaxoSmithKline, Johnson & Johnson
and Merck and Co., Inc.
Five Year Performance
2007 2008 2009 2010 2011 2012
PFIZER 100.0 83.1 90.0 90.3 116.3 140.0
PEER GROUP 100.0 84.7 95.6 95.2 111.5 123.4
S&P 500 100.0 63.0 79.7 91.7 93.6 108.6