Pfizer 2012 Annual Report Download - page 88
Download and view the complete annual report
Please find page 88 of the 2012 Pfizer annual report below. You can navigate through the pages in the report by either clicking on the pages listed below, or by using the keyword search tool below to find specific information within the annual report.-
 1
1 -
2
-
3
-
4
-
5
-
6
-
7
-
8
-
9
-
10
-
11
-
12
-
13
-
14
-
15
-
16
-
17
-
18
-
19
-
20
-
21
-
22
-
23
-
24
-
25
-
26
-
27
-
28
-
29
-
30
-
31
-
32
-
33
-
34
-
35
-
36
-
37
-
38
-
39
-
40
-
41
-
42
-
43
-
44
-
45
-
46
-
47
-
48
-
49
-
50
-
51
-
52
-
53
-
54
-
55
-
56
-
57
-
58
-
59
-
60
-
61
-
62
-
63
-
64
-
65
-
66
-
67
-
68
-
69
-
70
-
71
-
72
-
73
-
74
-
75
-
76
-
77
-
 78
78 -
 79
79 -
 80
80 -
 81
81 -
 82
82 -
 83
83 -
 84
84 -
 85
85 -
 86
86 -
 87
87 -
 88
88 -
 89
89 -
 90
90 -
 91
91 -
 92
92 -
 93
93 -
 94
94 -
 95
95 -
 96
96 -
 97
97 -
 98
98 -
99
-
100
-
101
-
102
-
103
-
104
-
105
-
106
-
107
-
108
-
109
-
110
-
111
-
112
-
113
-
114
-
115
-
116
-
117
-
118
-
119
-
120
-
121
 |
 |

Notes to Consolidated Financial Statements
Pfizer Inc. and Subsidiary Companies
2012 Financial Report
87
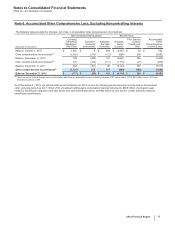
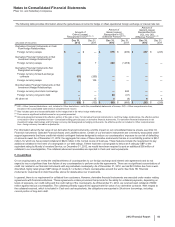
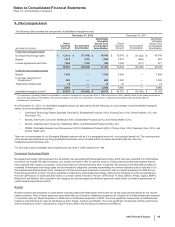
A. Components of Net Periodic Benefit Costs and Changes in Other Comprehensive Loss
The following table provides the annual cost and changes in Other comprehensive loss for our benefit plans:
Year Ended December 31,
Pension Plans
U.S.
Qualified(a)
U.S.
Supplemental
(Non-Qualified)(b) International(c) Postretirement
Plans(d)
(MILLIONS OF DOLLARS) 2012 2011 2010 2012 2011 2010 2012 2011 2010 2012 2011 2010
Service cost(e) $ 357 $ 351 347 $35 $36 28$215 $ 243 224 $68$68 79
Interest cost(e) 697 734 740 62 72 77 406 443 418 182 195 211
Expected return on plan
assets(e) (983) (871)(782)———(424) (437) (425) (46) (35) (31)
Amortization of:
Actuarial losses(e) 306 145 151 41 36 29 93 86 67 33 17 15
Prior service credits (10) (8) 2 (3)(3) (2) (7) (5) (4) (49) (53) (38)
Curtailments and
settlements––net 83 95 (52) 24 23 1 (9) —(3)(65) (68) (23)
Special termination benefits 823 73 30 26 180 5566319
Net periodic benefit costs 458 469 479 189 190 313 279 335 283 129 127 232
Changes in Other
comprehensive loss(f) 461 1,879 260 110 36 117 759 (365) 152 267 421 (183)
Total amount recognized in
comprehensive income $919$2,348 $ 739 $ 299 $ 226 $ 430 $1 , 0 3 8 $ (30) $ 435 $396 $548 $ 49
(a) 2012 v. 2011––The decrease in net periodic benefit cost for our U.S. qualified plans was primarily driven by (i) higher expected return on plan assets (resulting
from contributions made to the plan in 2011 that increased the plan asset base), (ii) lower interest costs, (iii) a decrease in special termination benefits, and (iv)
lower curtailments and settlements––net due to the curtailment gain resulting from the decision to freeze the defined benefit plans in the U.S. and Puerto Rico
largely offset by an increase in the amounts amortized for actuarial losses (resulting from a decrease in the discount rate and lower than expected actual returns
in 2011). 2011 v. 2010––The decrease in the U.S. qualified pension plans' net periodic benefit costs was largely driven by lower special termination benefits
costs and higher expected returns due to contributions made to the plans, partially offset by lower curtailment gains and an increase in settlement costs
associated with on-going restructuring efforts.
(b) 2012 v. 2011––The net periodic benefit cost for our U.S. supplemental (non-qualified) pension plans was largely unchanged as the curtailment gain resulting
from the decision to freeze the defined benefit plans in the U.S. and Puerto Rico was more than offset by higher settlement activity. 2011 v. 2010––The
decrease in the U.S. supplemental (non-qualified) plans’ net periodic benefit costs was primarily driven by lower special termination benefits costs associated
with Wyeth-related restructuring initiatives.
(c) 2012 v. 2011––The decrease in net periodic benefit costs for our international pension plans was primarily driven by changes impacting our U.K. plans in 2011
(see (e) below) as well as higher curtailment gains resulting from ongoing restructuring initiatives. 2011 v. 2010––The increase in the international plans’ net
periodic benefit costs as compared to the prior year was primarily driven by changes in assumptions, including the decrease in discount rates across most
plans.
(d) 2012 v. 2011––The net periodic benefit cost for our postretirement plans was largely unchanged, as an increase in amounts amortized for actuarial plan losses
was partially offset by higher expected return on plan assets. 2011 v. 2010––The decrease in the postretirement plans’ net periodic benefit costs was due to the
harmonization of the Wyeth postretirement medical program initiated in mid-2010.
(e) The decrease in service cost in 2012 for our international plans is largely driven by restructuring activities in the U.K. and Ireland. The decrease in interest cost
in 2012 and 2011 reflect lower interest rates during the periods. The increase in the expected return on plan assets in 2012 for our U.S. qualified plans is due to
a higher plan asset base. The higher amortization of actuarial losses is due larger accumulated actuarial losses resulting from lower interest rates.
(f) For details, see our Consolidated Statements of Comprehensive Income and Note 6. Accumulated Other Comprehensive Loss, Excluding Noncontrolling
Interests.
The following table provides the amounts in Accumulated other comprehensive loss expected to be amortized into 2013 net periodic benefit
costs:
Pension Plans
(MILLIONS OF DOLLARS)
U.S.
Qualified
U.S.
Supplemental
(Non-Qualified) International
Postretirement
Plans
Actuarial losses $ (360)$ (54)$ (149)$ (46)
Prior service credits and other 7 28 45
Total $ (353)$ (52)$ (141)$ (1)