Pfizer 2012 Annual Report Download - page 81
Download and view the complete annual report
Please find page 81 of the 2012 Pfizer annual report below. You can navigate through the pages in the report by either clicking on the pages listed below, or by using the keyword search tool below to find specific information within the annual report.-
 1
1 -
2
-
3
-
4
-
5
-
6
-
7
-
8
-
9
-
10
-
11
-
12
-
13
-
14
-
15
-
16
-
17
-
18
-
19
-
20
-
21
-
22
-
23
-
24
-
25
-
26
-
27
-
28
-
29
-
30
-
31
-
32
-
33
-
34
-
35
-
36
-
37
-
38
-
39
-
40
-
41
-
42
-
43
-
44
-
45
-
46
-
47
-
48
-
49
-
50
-
51
-
52
-
53
-
54
-
55
-
56
-
57
-
58
-
59
-
60
-
61
-
62
-
63
-
64
-
65
-
66
-
67
-
68
-
69
-
70
-
 71
71 -
 72
72 -
 73
73 -
 74
74 -
 75
75 -
 76
76 -
 77
77 -
 78
78 -
 79
79 -
 80
80 -
 81
81 -
 82
82 -
 83
83 -
 84
84 -
 85
85 -
 86
86 -
 87
87 -
 88
88 -
 89
89 -
 90
90 -
 91
91 -
92
-
93
-
94
-
95
-
96
-
97
-
98
-
99
-
100
-
101
-
102
-
103
-
104
-
105
-
106
-
107
-
108
-
109
-
110
-
111
-
112
-
113
-
114
-
115
-
116
-
117
-
118
-
119
-
120
-
121
 |
 |

Notes to Consolidated Financial Statements
Pfizer Inc. and Subsidiary Companies
80
2012 Financial Report
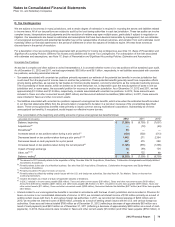
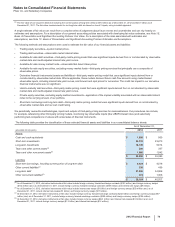
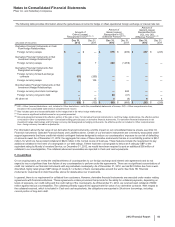
In addition, we have long-term receivables where the determination of fair value employs discounted future cash flows, using current interest
rates at which similar loans would be made to borrowers with similar credit ratings and for the same remaining maturities. The differences
between the estimated fair values and carrying values of these receivables were not significant as of December 31, 2012 or December 31,
2011.
There were no significant impairments of financial assets recognized in any period presented.
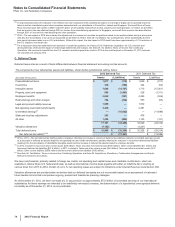
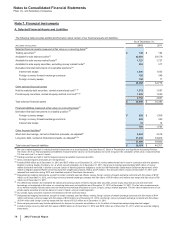
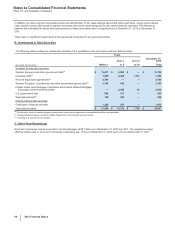
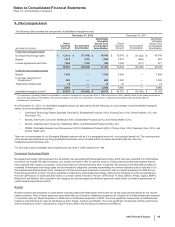
B. Investments in Debt Securities
The following table provides the contractual maturities of the available-for-sale and held-to-maturity debt securities:
Years
Over 1 Over 5
December 31,
2012
(MILLIONS OF DOLLARS) Within 1 to 5 to 10 Total
Available-for-sale debt securities
Western European and other government debt(a) $13,671 $2,084 $—$ 15,755
Corporate debt(b) 1,085 4,468 1,741 7,294
Reverse repurchase agreements(c) 2,790 —— 2,790
Western European, Scandinavian and other government agency debt(a) 2,348 415 —2,763
Federal Home Loan Mortgage Corporation and Federal National Mortgage
Association asset-backed securities —2,492 43 2,535
U.S. government debt 688 197 —885
Supranational debt(a) 168 394 —562
Held-to-maturity debt securities
Certificates of deposit and other 1,240 273 —1,513
Total debt securities $21,990 $10,323 $1,784 $34,097
(a) All issued by above-investment-grade governments, government agencies or supranational entities, as applicable.
(b) Largely issued by above-investment-grade institutions in the financial services sector.
(c) Involving U.S. government securities.
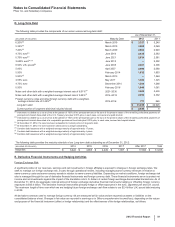
C. Short-Term Borrowings
Short-term borrowings include amounts for commercial paper of $2.7 billion as of December 31, 2012 and 2011. The weighted-average
effective interest rate on short-term borrowings outstanding was 1.6% as of December 31, 2012 and 0.2% as of December 31, 2011.