Pfizer 2012 Annual Report Download - page 92
Download and view the complete annual report
Please find page 92 of the 2012 Pfizer annual report below. You can navigate through the pages in the report by either clicking on the pages listed below, or by using the keyword search tool below to find specific information within the annual report.-
 1
1 -
2
-
3
-
4
-
5
-
6
-
7
-
8
-
9
-
10
-
11
-
12
-
13
-
14
-
15
-
16
-
17
-
18
-
19
-
20
-
21
-
22
-
23
-
24
-
25
-
26
-
27
-
28
-
29
-
30
-
31
-
32
-
33
-
34
-
35
-
36
-
37
-
38
-
39
-
40
-
41
-
42
-
43
-
44
-
45
-
46
-
47
-
48
-
49
-
50
-
51
-
52
-
53
-
54
-
55
-
56
-
57
-
58
-
59
-
60
-
61
-
62
-
63
-
64
-
65
-
66
-
67
-
68
-
69
-
70
-
71
-
72
-
73
-
74
-
75
-
76
-
77
-
78
-
79
-
80
-
81
-
 82
82 -
 83
83 -
 84
84 -
 85
85 -
 86
86 -
 87
87 -
 88
88 -
 89
89 -
 90
90 -
 91
91 -
 92
92 -
 93
93 -
 94
94 -
 95
95 -
 96
96 -
 97
97 -
 98
98 -
 99
99 -
 100
100 -
 101
101 -
 102
102 -
103
-
104
-
105
-
106
-
107
-
108
-
109
-
110
-
111
-
112
-
113
-
114
-
115
-
116
-
117
-
118
-
119
-
120
-
121
 |
 |

Notes to Consolidated Financial Statements
Pfizer Inc. and Subsidiary Companies
2012 Financial Report
91
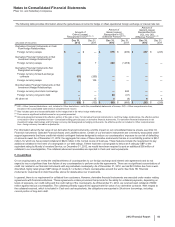
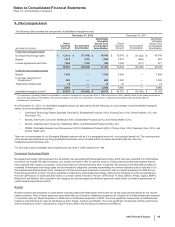
D. Plan Assets
The following table provides the components of plan assets:
Fair Value(a) Fair Value(a)
(MILLIONS OF DOLLARS)
As of
December 31,
2012 Level 1 Level 2 Level 3
As of
December 31,
2011 Level 1 Level 2 Level 3
U.S. qualified pension plans
Cash and cash equivalents $368$
—$368 $—$2,111 $—$
2,111 $—
Equity securities:
Global equity securities 3,536 3,519 17 — 2,522 2,509 12 1
Equity commingled funds 2,215 — 2,215 —1,794 —1,794 —
Debt securities:
Fixed income commingled
funds 943 — 943 —870 —870 —
Government bonds 1,093 — 1,093 —808 —805 3
Corporate debt securities 2,414 — 2,411 31,971 —1,966 5
Other investments:
Private equity funds 866 ——866 920 ——
920
Insurance contracts 348 —348 —353 —353 —
Other 757 ——757 656 ——
656
Total 12,540 3,519 7,395 1,626 12,005 2,509 7,911 1,585
International pension plans
Cash and cash equivalents 299 — 299 —299 —299 —
Equity securities:
Global equity securities 1,723 1,638 85 — 1,513 1,432 81 —
Equity commingled funds 2,194 — 2,194 —1,966 —1,966 —
Debt securities:
Fixed income commingled
funds 825 — 825 —785 —785 —
Government bonds 914 — 914 —956 —956 —
Corporate debt securities 613 — 613 —536 —536 —
Other investments:
Private equity funds 110 —14 96 55 — 451
Insurance contracts 465 — 117 348 433 —67
366
Other 446 —57 389 410 —62
348
Total 7,589 1,638 5,118 833 6,953 1,432 4,756 765
U.S. postretirement plans(b)
Cash and cash equivalents 28 —28 — 19 — 19 —
Equity securities:
Global equity securities 79 79 —— 24 24 — —
Equity commingled funds 50 —50 — 17 — 17 —
Debt securities:
Fixed income commingled
funds 20 —20 — 8— 8—
Government bonds 25 —25 — 8— 8—
Corporate debt securities 55 —55 — 19 — 19 —
Other investments:
Insurance contracts 350 — 350 —312 —312 —
Other 37 —37 — 15 — 15 —
Total $644$
79 $565 $—$422 $24$
398 $—
(a) Fair values are determined based on valuation inputs categorized as Level 1, 2 or 3 (see Note 1E. Basis of Presentation and Significant Accounting Policies:
Fair Value).