Pfizer 2012 Annual Report Download - page 16
Download and view the complete annual report
Please find page 16 of the 2012 Pfizer annual report below. You can navigate through the pages in the report by either clicking on the pages listed below, or by using the keyword search tool below to find specific information within the annual report.-
 1
1 -
2
-
3
-
4
-
5
-
 6
6 -
 7
7 -
 8
8 -
 9
9 -
 10
10 -
 11
11 -
 12
12 -
 13
13 -
 14
14 -
 15
15 -
 16
16 -
 17
17 -
 18
18 -
 19
19 -
 20
20 -
 21
21 -
 22
22 -
 23
23 -
 24
24 -
 25
25 -
 26
26 -
27
-
28
-
29
-
30
-
31
-
32
-
33
-
34
-
35
-
36
-
37
-
38
-
39
-
40
-
41
-
42
-
43
-
44
-
45
-
46
-
47
-
48
-
49
-
50
-
51
-
52
-
53
-
54
-
55
-
56
-
57
-
58
-
59
-
60
-
61
-
62
-
63
-
64
-
65
-
66
-
67
-
68
-
69
-
70
-
71
-
72
-
73
-
74
-
75
-
76
-
77
-
78
-
79
-
80
-
81
-
82
-
83
-
84
-
85
-
86
-
87
-
88
-
89
-
90
-
91
-
92
-
93
-
94
-
95
-
96
-
97
-
98
-
99
-
100
-
101
-
102
-
103
-
104
-
105
-
106
-
107
-
108
-
109
-
110
-
111
-
112
-
113
-
114
-
115
-
116
-
117
-
118
-
119
-
120
-
121
 |
 |

Financial Review
Pfizer Inc. and Subsidiary Companies
2012 Financial Report
15
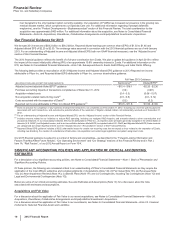
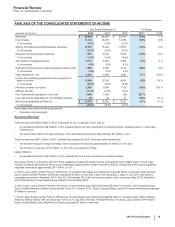
ANALYSIS OF THE CONSOLIDATED STATEMENTS OF INCOME
Year Ended December 31, % Change
(MILLIONS OF DOLLARS) 2012 2011 2010 12/11 11/10
Revenues $58,986 $ 65,259 $ 65,165 (10)% —%
Cost of sales 11,334 14,076 14,788 (19)% (5)%
% of revenues 19.2%21.6%22.7%
Selling, informational and administrative expenses 16,616 18,832 18,973 (12)% (1)%
% of revenues 28.2%28.9%29.1%
Research and development expenses 7,870 9,074 9,483 (13)% (4)%
% of revenues 13.3%13.9%14.6%
Amortization of intangible assets 5,175 5,544 5,364 (7)% 3%
% of revenues 8.8% 8.5% 8.2%
Restructuring charges and certain acquisition-related costs 1,880 2,930 3,145 (36)% (7)%
% of revenues 3.2% 4.5% 4.8%
Other deductions—net 4,031 2,499 3,941 61 % (37)%
Income from continuing operations before provision for
taxes on income 12,080 12,304 9,471 (2)% 30 %
% of revenues 20.5%18.9%14.5%
Provision for taxes on income 2,562 3,909 1,153 (34)% 239 %
Effective tax rate 21.2%31.8%12.2%
Plus: Discontinued operations—net of tax 5,080 1,654 (30)207 %*
Less: Net income attributable to noncontrolling interests 28 40 31 (30)% 29 %
Net income attributable to Pfizer Inc. $14,570 $ 10,009 $ 8,257 46 % 21 %
% of revenues 24.7%15.3%12.7%
Percentages may reflect rounding adjustments.
* Calculation not meaningful.
Revenues-Overview
Total revenues were $59.0 billion in 2012, a decrease of 10% compared to 2011, due to:
• an operational decline of $4.8 billion, or 8%, primarily due to the loss of exclusivity of certain products, including Lipitor, in most major
markets; and
• the unfavorable impact of foreign exchange, which decreased revenues by approximately $1.5 billion, or 2%.
Total revenues were $65.3 billion in 2011, relatively flat compared to 2010. Revenues were impacted by:
• the favorable impact of foreign exchange, which increased revenues by approximately $1.9 billion, or 3%; and
• the inclusion of revenues of $1.3 billion, or 2%, from our acquisition of King,
largely offset by:
• an operational decline of $2.9 billion, or 4%, primarily due to the loss of exclusivity of certain products.
Revenues in 2012 in comparison with 2011 were negatively impacted by product losses of exclusivity, most notably Lipitor in most major
markets, as well as the final-year terms of our collaboration agreements in certain markets for Spiriva. Collectively, these factors negatively
impacted revenues by approximately $7.7 billion, or 12%.
In 2012, Lyrica, Lipitor, Enbrel, Prevnar 13/Prevenar 13, Celebrex and Viagra each delivered at least $2 billion in revenues, while Norvasc,
Zyvox, Sutent and the Premarin family each surpassed $1 billion in revenues. Lipitor lost exclusivity in Japan in June 2011 (with generic
competition occurring in November 2011), the U.S. in November 2011 (with multi-source generic entry occurring in May 2012), Australia in
April 2012 and most of developed Europe in March 2012 and May 2012.
In 2011, Lipitor, Lyrica, Enbrel, Prevnar 13/Prevenar 13 and Celebrex each delivered at least $2 billion in revenues, while Viagra, Norvasc,
Zyvox, Xalatan/Xalacom (Xalatan lost exclusivity in the U.S. in March 2011), Sutent, Geodon/Zeldox, and the Premarin family each surpassed
$1 billion in revenues.
In 2010, Lipitor, Enbrel, Lyrica, Prevnar 13/Prevenar 13 and Celebrex each delivered at least $2 billion in revenues, while Viagra, Xalatan/
Xalacom, Effexor (Effexor XR lost exclusivity in the U.S. in July 2010), Norvasc, Prevnar/Prevenar (7-valent), Zyvox, Sutent, the Premarin
family, Geodon/Zeldox and Detrol/Detrol LA each surpassed $1 billion in revenues.