eTrade 2012 Annual Report Download - page 166
Download and view the complete annual report
Please find page 166 of the 2012 eTrade annual report below. You can navigate through the pages in the report by either clicking on the pages listed below, or by using the keyword search tool below to find specific information within the annual report.-
 1
1 -
2
-
3
-
4
-
5
-
6
-
7
-
8
-
9
-
10
-
11
-
12
-
13
-
14
-
15
-
16
-
17
-
18
-
19
-
20
-
21
-
22
-
23
-
24
-
25
-
26
-
27
-
28
-
29
-
30
-
31
-
32
-
33
-
34
-
35
-
36
-
37
-
38
-
39
-
40
-
41
-
42
-
43
-
44
-
45
-
46
-
47
-
48
-
49
-
50
-
51
-
52
-
53
-
54
-
55
-
56
-
57
-
58
-
59
-
60
-
61
-
62
-
63
-
64
-
65
-
66
-
67
-
68
-
69
-
70
-
71
-
72
-
73
-
74
-
75
-
76
-
77
-
78
-
79
-
80
-
81
-
82
-
83
-
84
-
85
-
86
-
87
-
88
-
89
-
90
-
91
-
92
-
93
-
94
-
95
-
96
-
97
-
98
-
99
-
100
-
101
-
102
-
103
-
104
-
105
-
106
-
107
-
108
-
109
-
110
-
111
-
112
-
113
-
114
-
115
-
116
-
117
-
118
-
119
-
120
-
121
-
122
-
123
-
124
-
125
-
126
-
127
-
128
-
129
-
130
-
131
-
132
-
133
-
134
-
135
-
136
-
137
-
138
-
139
-
140
-
141
-
142
-
143
-
144
-
145
-
146
-
147
-
148
-
149
-
150
-
151
-
152
-
153
-
154
-
155
-
 156
156 -
 157
157 -
 158
158 -
 159
159 -
 160
160 -
 161
161 -
 162
162 -
 163
163 -
 164
164 -
 165
165 -
 166
166 -
 167
167 -
 168
168 -
 169
169 -
 170
170 -
 171
171 -
 172
172 -
 173
173 -
 174
174 -
 175
175 -
 176
176 -
177
-
178
-
179
-
180
-
181
-
182
-
183
-
184
-
185
-
186
-
187
-
188
-
189
-
190
-
191
-
192
-
193
-
194
-
195
-
196
-
197
-
198
-
199
-
200
-
201
-
202
-
203
-
204
-
205
-
206
-
207
-
208
-
209
-
210
-
211
-
212
-
213
-
214
-
215
-
216
-
217
-
218
-
219
-
220
-
221
-
222
-
223
-
224
-
225
-
226
-
227
-
228
-
229
-
230
-
231
-
232
-
233
-
234
-
235
-
236
-
237
-
238
-
239
-
240
-
241
-
242
-
243
-
244
-
245
-
246
-
247
-
248
-
249
-
250
-
251
-
252
-
253
 |
 |

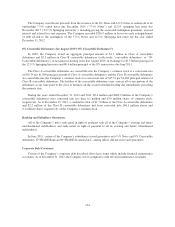
Banking
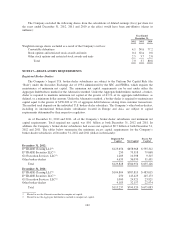
E*TRADE Bank is subject to various regulatory capital requirements administered by federal banking
agencies. Failure to meet minimum capital requirements can trigger certain mandatory and possibly additional
discretionary actions by regulators that, if undertaken, could have a direct material effect on E*TRADE Bank’s
financial condition and results of operations. Under capital adequacy guidelines and the regulatory framework for
prompt corrective action, E*TRADE Bank must meet specific capital guidelines that involve quantitative
measures of E*TRADE Bank’s assets, liabilities and certain off-balance sheet items as calculated under
regulatory accounting practices. In addition, E*TRADE Bank may not pay dividends to the parent company
without approval from its regulators and any loans by E*TRADE Bank to the parent company and its other non-
bank subsidiaries are subject to various quantitative, arm’s length, collateralization and other requirements.
E*TRADE Bank’s capital amounts and classification are also subject to qualitative judgments by the regulators
about components, risk weightings and other factors.
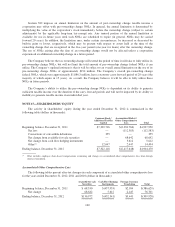
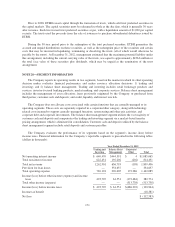
Quantitative measures established by regulation to ensure capital adequacy require E*TRADE Bank to meet
minimum total capital, Tier 1 capital and Tier 1 leverage ratios. As shown in the table below, at both
December 31, 2012 and 2011, E*TRADE Bank was categorized as “well capitalized” under the regulatory
framework for prompt corrective action. However, events beyond management’s control, such as a continued
deterioration in residential real estate and credit markets, could adversely affect future earnings and E*TRADE
Bank’s ability to meet its future capital requirements. E*TRADE Bank’s actual and required capital amounts and
ratios at December 31, 2012 and 2011 are presented in the table below (dollars in thousands):
Actual
Minimum Required to be
Well Capitalized Under
Prompt Corrective
Action Provisions
Amount Ratio Amount Ratio Excess Capital
December 31, 2012:
Total capital $4,009,540 20.61% >$1,945,669 >10.00% $2,063,871
Tier 1 capital $3,762,242 19.34% >$1,167,401 > 6.00% $2,594,841
Tier 1 leverage(1) $3,762,242 8.68% >$2,167,136 > 5.00% $1,595,106
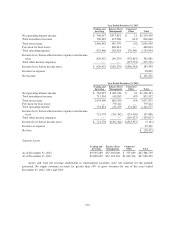
December 31, 2011:
Total capital to risk-weighted assets $3,602,384 17.27% >$2,086,243 >10.00% $1,516,141
Tier 1 capital to risk-weighted assets $3,338,618 16.00% >$1,251,746 > 6.00% $2,086,872
Tier 1 capital to adjusted total assets $3,351,860 7.75% >$2,163,785 > 5.00% $1,188,075
(1) In the first quarter of 2012, the Company transitioned from reporting under the OTS reporting requirements to reporting under the OCC
reporting requirements. The OTS Tier 1 capital ratio and OCC Tier 1 leverage ratio are both calculated in the same manner using
adjusted total assets.
163