eTrade 2012 Annual Report Download - page 40
Download and view the complete annual report
Please find page 40 of the 2012 eTrade annual report below. You can navigate through the pages in the report by either clicking on the pages listed below, or by using the keyword search tool below to find specific information within the annual report.-
 1
1 -
2
-
3
-
4
-
5
-
6
-
7
-
8
-
9
-
10
-
11
-
12
-
13
-
14
-
15
-
16
-
17
-
18
-
19
-
20
-
21
-
22
-
23
-
24
-
25
-
26
-
27
-
28
-
29
-
 30
30 -
 31
31 -
 32
32 -
 33
33 -
 34
34 -
 35
35 -
 36
36 -
 37
37 -
 38
38 -
 39
39 -
 40
40 -
 41
41 -
 42
42 -
 43
43 -
 44
44 -
 45
45 -
 46
46 -
 47
47 -
 48
48 -
 49
49 -
 50
50 -
51
-
52
-
53
-
54
-
55
-
56
-
57
-
58
-
59
-
60
-
61
-
62
-
63
-
64
-
65
-
66
-
67
-
68
-
69
-
70
-
71
-
72
-
73
-
74
-
75
-
76
-
77
-
78
-
79
-
80
-
81
-
82
-
83
-
84
-
85
-
86
-
87
-
88
-
89
-
90
-
91
-
92
-
93
-
94
-
95
-
96
-
97
-
98
-
99
-
100
-
101
-
102
-
103
-
104
-
105
-
106
-
107
-
108
-
109
-
110
-
111
-
112
-
113
-
114
-
115
-
116
-
117
-
118
-
119
-
120
-
121
-
122
-
123
-
124
-
125
-
126
-
127
-
128
-
129
-
130
-
131
-
132
-
133
-
134
-
135
-
136
-
137
-
138
-
139
-
140
-
141
-
142
-
143
-
144
-
145
-
146
-
147
-
148
-
149
-
150
-
151
-
152
-
153
-
154
-
155
-
156
-
157
-
158
-
159
-
160
-
161
-
162
-
163
-
164
-
165
-
166
-
167
-
168
-
169
-
170
-
171
-
172
-
173
-
174
-
175
-
176
-
177
-
178
-
179
-
180
-
181
-
182
-
183
-
184
-
185
-
186
-
187
-
188
-
189
-
190
-
191
-
192
-
193
-
194
-
195
-
196
-
197
-
198
-
199
-
200
-
201
-
202
-
203
-
204
-
205
-
206
-
207
-
208
-
209
-
210
-
211
-
212
-
213
-
214
-
215
-
216
-
217
-
218
-
219
-
220
-
221
-
222
-
223
-
224
-
225
-
226
-
227
-
228
-
229
-
230
-
231
-
232
-
233
-
234
-
235
-
236
-
237
-
238
-
239
-
240
-
241
-
242
-
243
-
244
-
245
-
246
-
247
-
248
-
249
-
250
-
251
-
252
-
253
 |
 |
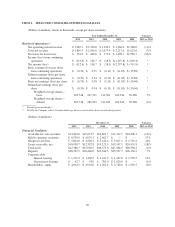
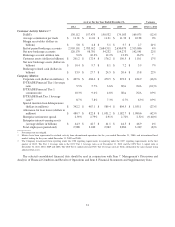
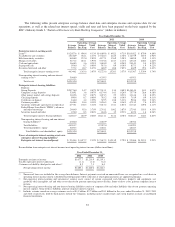
The following tables present enterprise average balance sheet data and enterprise income and expense data for our
operations, as well as the related net interest spread, yields and rates and have been prepared on the basis required by the
SEC’s Industry Guide 3, “Statistical Disclosure by Bank Holding Companies” (dollars in millions):
Year Ended December 31,
2012 2011 2010
Average
Balance
Operating
Interest
Inc./Exp.
Average
Yield/
Cost
Average
Balance
Operating
Interest
Inc./Exp.
Average
Yield/
Cost
Average
Balance
Operating
Interest
Inc./Exp.
Average
Yield/
Cost
Enterprise interest-earning assets:
Loans(1) $12,027.6 $ 496.4 4.13% $14,689.8 $ 692.1 4.71% $18,302.2 $ 879.0 4.80%
Available-for-sale securities 15,236.9 361.1 2.37% 15,326.5 422.5 2.76% 13,275.9 387.5 2.92%
Held-to-maturity securities 8,408.9 237.0 2.82% 4,177.1 136.9 3.28% 1,085.8 35.9 3.31%
Margin receivables 5,471.2 216.1 3.95% 5,374.8 221.7 4.13% 4,532.5 200.3 4.42%
Cash and equivalents 1,668.3 3.6 0.21% 1,618.9 3.2 0.20% 2,414.3 5.4 0.22%
Segregated cash 956.0 0.7 0.08% 915.6 0.9 0.10% 857.1 1.9 0.22%
Securities borrowed and other 577.2 48.7 8.43% 620.9 48.8 7.85% 662.9 29.4 4.43%
Total enterprise interest-earning assets 44,346.1 1,363.6 3.07% 42,723.6 1,526.1 3.57% 41,130.7 1,539.4 3.74%
Non-operating interest-earning and non-interest
earning assets(2) 5,068.9 4,339.5 4,395.1
Total assets $49,415.0 $47,063.1 $45,525.8
Enterprise interest-bearing liabilities:
Deposits:
Sweep Deposits $20,776.0 14.7 0.07% $17,513.1 13.4 0.08% $14,014.4 10.1 0.07%
Complete savings deposits 5,389.1 3.6 0.07% 6,174.4 16.1 0.26% 7,577.0 28.6 0.38%
Other money market and savings deposits 1,015.8 0.7 0.07% 1,071.5 2.5 0.23% 1,114.6 2.8 0.25%
Checking deposits 890.4 0.7 0.08% 783.2 0.8 0.10% 761.9 0.9 0.11%
Certificates of deposit 166.0 4.4 2.59% 319.5 10.0 3.13% 910.6 20.4 2.24%
Customer payables 5,648.4 10.4 0.18% 5,456.3 8.6 0.16% 4,713.2 7.0 0.15%
Securities sold under agreements to repurchase 4,775.1 158.5 3.32% 5,417.2 153.1 2.83% 6,154.3 129.6 2.11%
Federal Home Loan Bank (“FHLB”) advances
and other borrowings 2,464.9 92.6 3.76% 2,741.1 106.2 3.87% 2,754.3 119.3 4.33%
Securities loaned and other 676.0 0.3 0.04% 634.8 1.5 0.23% 622.4 1.6 0.26%
Total enterprise interest-bearing liabilities 41,801.7 285.9 0.68% 40,111.1 312.2 0.78% 38,622.7 320.3 0.83%
Non-operating interest-bearing and non-interest
bearing liabilities(3) 2,580.0 2,285.9 2,876.4
Total liabilities 44,381.7 42,397.0 41,499.1
Total shareholders’ equity 5,033.3 4,666.1 4,026.7
Total liabilities and shareholders’ equity $49,415.0 $47,063.1 $45,525.8
Excess of enterprise interest-earning assets over
enterprise interest-bearing liabilities/
Enterprise net interest income/Spread $ 2,544.4 $1,077.7 2.39% $ 2,612.5 $1,213.9 2.79% $ 2,508.0 $1,219.1 2.91%
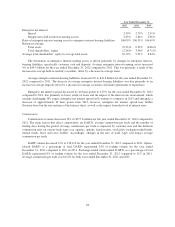
Reconciliation from enterprise net interest income to net operating interest income (dollars in millions):
Year Ended December 31,
2012 2011 2010
Enterprise net interest income $1,077.7 $1,213.9 $1,219.1
Taxable equivalent interest adjustment (1.1) (1.2) (1.2)
Customer cash held by third parties and other(4) 8.5 7.3 8.4
Net operating interest income $1,085.1 $1,220.0 $1,226.3
(1) Nonaccrual loans are included in the average loan balances. Interest payments received on nonaccrual loans are recognized on a cash basis in
operating interest income until it is doubtful that full payment will be collected, at which point payments are applied to principal.
(2) Non-operating interest-earning and non-interest earning assets consist of certain segregated cash balances, property and equipment, net,
goodwill, other intangibles, net and other assets that do not generate operating interest income. Some of these assets generate corporate interest
income.
(3) Non-operating interest-bearing and non-interest bearing liabilities consist of corporate debt and other liabilities that do not generate operating
interest expense. Some of these liabilities generate corporate interest expense.
(4) Includes revenue earned on average customer assets of $4.3 billion, $3.7 billion and $3.1 billion for the years ended December 31, 2012, 2011
and 2010, respectively, held by third parties outside the Company, including money market funds and sweep deposit accounts at unaffiliated
financial institutions.
37