eTrade 2012 Annual Report Download - page 91
Download and view the complete annual report
Please find page 91 of the 2012 eTrade annual report below. You can navigate through the pages in the report by either clicking on the pages listed below, or by using the keyword search tool below to find specific information within the annual report.-
 1
1 -
2
-
3
-
4
-
5
-
6
-
7
-
8
-
9
-
10
-
11
-
12
-
13
-
14
-
15
-
16
-
17
-
18
-
19
-
20
-
21
-
22
-
23
-
24
-
25
-
26
-
27
-
28
-
29
-
30
-
31
-
32
-
33
-
34
-
35
-
36
-
37
-
38
-
39
-
40
-
41
-
42
-
43
-
44
-
45
-
46
-
47
-
48
-
49
-
50
-
51
-
52
-
53
-
54
-
55
-
56
-
57
-
58
-
59
-
60
-
61
-
62
-
63
-
64
-
65
-
66
-
67
-
68
-
69
-
70
-
71
-
72
-
73
-
74
-
75
-
76
-
77
-
78
-
79
-
80
-
 81
81 -
 82
82 -
 83
83 -
 84
84 -
 85
85 -
 86
86 -
 87
87 -
 88
88 -
 89
89 -
 90
90 -
 91
91 -
 92
92 -
 93
93 -
 94
94 -
 95
95 -
 96
96 -
 97
97 -
 98
98 -
 99
99 -
 100
100 -
 101
101 -
102
-
103
-
104
-
105
-
106
-
107
-
108
-
109
-
110
-
111
-
112
-
113
-
114
-
115
-
116
-
117
-
118
-
119
-
120
-
121
-
122
-
123
-
124
-
125
-
126
-
127
-
128
-
129
-
130
-
131
-
132
-
133
-
134
-
135
-
136
-
137
-
138
-
139
-
140
-
141
-
142
-
143
-
144
-
145
-
146
-
147
-
148
-
149
-
150
-
151
-
152
-
153
-
154
-
155
-
156
-
157
-
158
-
159
-
160
-
161
-
162
-
163
-
164
-
165
-
166
-
167
-
168
-
169
-
170
-
171
-
172
-
173
-
174
-
175
-
176
-
177
-
178
-
179
-
180
-
181
-
182
-
183
-
184
-
185
-
186
-
187
-
188
-
189
-
190
-
191
-
192
-
193
-
194
-
195
-
196
-
197
-
198
-
199
-
200
-
201
-
202
-
203
-
204
-
205
-
206
-
207
-
208
-
209
-
210
-
211
-
212
-
213
-
214
-
215
-
216
-
217
-
218
-
219
-
220
-
221
-
222
-
223
-
224
-
225
-
226
-
227
-
228
-
229
-
230
-
231
-
232
-
233
-
234
-
235
-
236
-
237
-
238
-
239
-
240
-
241
-
242
-
243
-
244
-
245
-
246
-
247
-
248
-
249
-
250
-
251
-
252
-
253
 |
 |

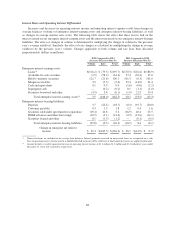
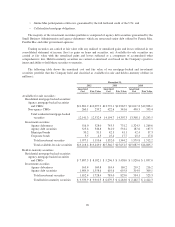
Interest Rates and Operating Interest Differential
Increases and decreases in operating interest income and operating interest expense result from changes in
average balances (volume) of enterprise interest-earning assets and enterprise interest-bearing liabilities, as well
as changes in average interest rates (rate). The following table shows the effect that these factors had on the
interest earned on our enterprise interest-earning assets and the interest incurred on our enterprise interest-bearing
liabilities. The effect of changes in volume is determined by multiplying the change in volume by the previous
year’s average yield/cost. Similarly, the effect of rate changes is calculated by multiplying the change in average
yield/cost by the previous year’s volume. Changes applicable to both volume and rate have been allocated
proportionately (dollars in millions):
2012 Compared to 2011
Increase (Decrease) Due To
2011 Compared to 2010
Increase (Decrease) Due To
Volume Rate Total Volume Rate Total
Enterprise interest-earning assets:
Loans(1) $(116.2) $ (79.5) $(195.7) $(170.5) $(16.4) $(186.9)
Available-for-sale securities (2.5) (58.9) (61.4) 57.4 (22.4) 35.0
Held-to-maturity securities 121.7 (21.6) 100.1 101.3 (0.3) 101.0
Margin receivables 3.9 (9.5) (5.6) 35.4 (14.0) 21.4
Cash and equivalents 0.1 0.3 0.4 (1.6) (0.6) (2.2)
Segregated cash — (0.2) (0.2) 0.1 (1.1) (1.0)
Securities borrowed and other (3.5) 3.4 (0.1) (1.9) 21.3 19.4
Total enterprise interest-earning assets(2) 3.5 (166.0) (162.5) 20.2 (33.5) (13.3)
Enterprise interest-bearing liabilities:
Deposits 3.7 (22.4) (18.7) (0.3) (19.7) (20.0)
Customer payables 0.3 1.5 1.8 1.2 0.4 1.6
Securities sold under agreements to repurchase (19.4) 24.8 5.4 (16.9) 40.4 23.5
FHLB advances and other borrowings (10.5) (3.1) (13.6) (0.5) (12.6) (13.1)
Securities loaned and other 0.1 (1.3) (1.2) — (0.1) (0.1)
Total enterprise interest-bearing liabilities (25.8) (0.5) (26.3) (16.5) 8.4 (8.1)
Change in enterprise net interest
income $ 29.3 $(165.5) $(136.2) $ 36.7 $(41.9) $ (5.2)
(1) Nonaccrual loans are included in the average loan balances. Interest payments received on nonaccrual loans are recognized on a cash
basis in operating interest income until it is doubtful that full payment will be collected, at which point payments are applied to principal.
(2) Amount includes a taxable equivalent increase in operating interest income of $1.1 million, $1.2 million and $1.2 million for years ended
December 31, 2012, 2011 and 2010, respectively.
88