eTrade 2012 Annual Report Download - page 67
Download and view the complete annual report
Please find page 67 of the 2012 eTrade annual report below. You can navigate through the pages in the report by either clicking on the pages listed below, or by using the keyword search tool below to find specific information within the annual report.-
 1
1 -
2
-
3
-
4
-
5
-
6
-
7
-
8
-
9
-
10
-
11
-
12
-
13
-
14
-
15
-
16
-
17
-
18
-
19
-
20
-
21
-
22
-
23
-
24
-
25
-
26
-
27
-
28
-
29
-
30
-
31
-
32
-
33
-
34
-
35
-
36
-
37
-
38
-
39
-
40
-
41
-
42
-
43
-
44
-
45
-
46
-
47
-
48
-
49
-
50
-
51
-
52
-
53
-
54
-
55
-
56
-
 57
57 -
 58
58 -
 59
59 -
 60
60 -
 61
61 -
 62
62 -
 63
63 -
 64
64 -
 65
65 -
 66
66 -
 67
67 -
 68
68 -
 69
69 -
 70
70 -
 71
71 -
 72
72 -
 73
73 -
 74
74 -
 75
75 -
 76
76 -
 77
77 -
78
-
79
-
80
-
81
-
82
-
83
-
84
-
85
-
86
-
87
-
88
-
89
-
90
-
91
-
92
-
93
-
94
-
95
-
96
-
97
-
98
-
99
-
100
-
101
-
102
-
103
-
104
-
105
-
106
-
107
-
108
-
109
-
110
-
111
-
112
-
113
-
114
-
115
-
116
-
117
-
118
-
119
-
120
-
121
-
122
-
123
-
124
-
125
-
126
-
127
-
128
-
129
-
130
-
131
-
132
-
133
-
134
-
135
-
136
-
137
-
138
-
139
-
140
-
141
-
142
-
143
-
144
-
145
-
146
-
147
-
148
-
149
-
150
-
151
-
152
-
153
-
154
-
155
-
156
-
157
-
158
-
159
-
160
-
161
-
162
-
163
-
164
-
165
-
166
-
167
-
168
-
169
-
170
-
171
-
172
-
173
-
174
-
175
-
176
-
177
-
178
-
179
-
180
-
181
-
182
-
183
-
184
-
185
-
186
-
187
-
188
-
189
-
190
-
191
-
192
-
193
-
194
-
195
-
196
-
197
-
198
-
199
-
200
-
201
-
202
-
203
-
204
-
205
-
206
-
207
-
208
-
209
-
210
-
211
-
212
-
213
-
214
-
215
-
216
-
217
-
218
-
219
-
220
-
221
-
222
-
223
-
224
-
225
-
226
-
227
-
228
-
229
-
230
-
231
-
232
-
233
-
234
-
235
-
236
-
237
-
238
-
239
-
240
-
241
-
242
-
243
-
244
-
245
-
246
-
247
-
248
-
249
-
250
-
251
-
252
-
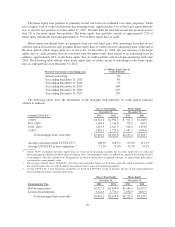
253
 |
 |

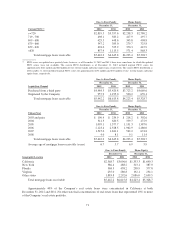
Other Sources of Liquidity
We also maintain uncommitted lines of credit with unaffiliated banks to finance margin lending, with
available balances subject to approval when utilized. At December 31, 2012, there were no outstanding balances.
We rely on borrowed funds, from sources such as securities sold under agreements to repurchase and FHLB
advances, to provide liquidity for E*TRADE Bank. Our ability to borrow these funds is dependent upon the
continued availability of funding in the wholesale borrowings market. In addition, we can borrow from the
Federal Reserve Bank’s discount window to meet short-term liquidity requirements, although it is not viewed as
a primary source of funding. At December 31, 2012, E*TRADE Bank had approximately $3.9 billion and $1.1
billion in additional collateralized borrowing capacity with the FHLB and the Federal Reserve Bank,
respectively. We also have the ability to generate liquidity in the form of additional deposits by raising the yield
on our customer deposit account products.
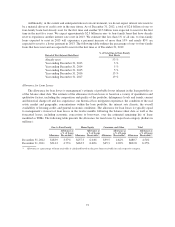
Off-Balance Sheet Arrangements
We enter into various off-balance-sheet arrangements in the ordinary course of business, primarily to meet
the needs of our customers and to reduce our own exposure to interest rate risk. These arrangements include firm
commitments to extend credit and letters of credit. Additionally, we enter into guarantees and other similar
arrangements as part of transactions in the ordinary course of business. For additional information on each of
these arrangements, see Note 19—Commitments, Contingencies and Other Regulatory Matters of Item 8.
Financial Statements and Supplementary Data.
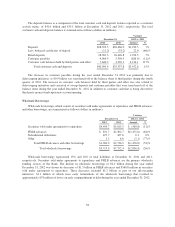
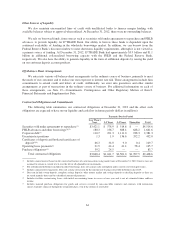
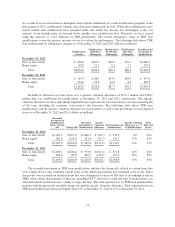
Contractual Obligations and Commitments
The following table summarizes our contractual obligations at December 31, 2012 and the effect such
obligations are expected to have on our liquidity and cash flow in future periods (dollars in millions):
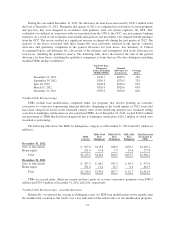
Payments Due by Period
Less Than 1
Year 1-3 Years 3-5 Years Thereafter Total
Securities sold under agreements to repurchase(1) $3,421.1 $ 578.9 $ 514.6 $ — $4,514.6
FHLB advances and other borrowings(1)(2) 188.3 136.7 688.4 648.2 1,661.6
Corporate debt(3) 110.7 221.3 1,111.0 938.3 2,381.3
Uncertain tax positions 1.3 1.9 136.6 352.2 492.0
Certificates of deposit and brokered certificates of
deposit(1)(4) 66.3 34.0 9.0 0.4 109.7
Operating lease payments(5) 21.5 44.4 41.4 58.4 165.7
Purchase obligations(6) 59.2 24.5 — — 83.7
Total contractual obligations $3,868.4 $1,041.7 $2,501.0 $1,997.5 $9,408.6
(1) Includes annual interest based on the contractual features of each transaction, using market rates at December 31, 2012. Interest rates are
assumed to remain at current levels over the life of all adjustable rate instruments.
(2) For subordinated debentures included in other borrowings, does not assume early redemption under current conversion provisions.
(3) Includes annual interest payments. Does not assume conversion for the non-interest bearing convertible debentures due 2019.
(4) Does not include sweep deposits, complete savings deposits, other money market and savings deposits or checking deposits as there are
no stated maturity dates and /or scheduled contractual payments.
(5) Includes facilities restructuring leases with initial or remaining terms in excess of one year and is net of estimated future sublease
income.
(6) Includes material purchase obligations for goods and services covered by non-cancelable contracts and contracts with termination
clauses. Includes contracts through the termination date, even if the contract is renewable.
64