eTrade 2012 Annual Report Download - page 65
Download and view the complete annual report
Please find page 65 of the 2012 eTrade annual report below. You can navigate through the pages in the report by either clicking on the pages listed below, or by using the keyword search tool below to find specific information within the annual report.-
 1
1 -
2
-
3
-
4
-
5
-
6
-
7
-
8
-
9
-
10
-
11
-
12
-
13
-
14
-
15
-
16
-
17
-
18
-
19
-
20
-
21
-
22
-
23
-
24
-
25
-
26
-
27
-
28
-
29
-
30
-
31
-
32
-
33
-
34
-
35
-
36
-
37
-
38
-
39
-
40
-
41
-
42
-
43
-
44
-
45
-
46
-
47
-
48
-
49
-
50
-
51
-
52
-
53
-
54
-
 55
55 -
 56
56 -
 57
57 -
 58
58 -
 59
59 -
 60
60 -
 61
61 -
 62
62 -
 63
63 -
 64
64 -
 65
65 -
 66
66 -
 67
67 -
 68
68 -
 69
69 -
 70
70 -
 71
71 -
 72
72 -
 73
73 -
 74
74 -
 75
75 -
76
-
77
-
78
-
79
-
80
-
81
-
82
-
83
-
84
-
85
-
86
-
87
-
88
-
89
-
90
-
91
-
92
-
93
-
94
-
95
-
96
-
97
-
98
-
99
-
100
-
101
-
102
-
103
-
104
-
105
-
106
-
107
-
108
-
109
-
110
-
111
-
112
-
113
-
114
-
115
-
116
-
117
-
118
-
119
-
120
-
121
-
122
-
123
-
124
-
125
-
126
-
127
-
128
-
129
-
130
-
131
-
132
-
133
-
134
-
135
-
136
-
137
-
138
-
139
-
140
-
141
-
142
-
143
-
144
-
145
-
146
-
147
-
148
-
149
-
150
-
151
-
152
-
153
-
154
-
155
-
156
-
157
-
158
-
159
-
160
-
161
-
162
-
163
-
164
-
165
-
166
-
167
-
168
-
169
-
170
-
171
-
172
-
173
-
174
-
175
-
176
-
177
-
178
-
179
-
180
-
181
-
182
-
183
-
184
-
185
-
186
-
187
-
188
-
189
-
190
-
191
-
192
-
193
-
194
-
195
-
196
-
197
-
198
-
199
-
200
-
201
-
202
-
203
-
204
-
205
-
206
-
207
-
208
-
209
-
210
-
211
-
212
-
213
-
214
-
215
-
216
-
217
-
218
-
219
-
220
-
221
-
222
-
223
-
224
-
225
-
226
-
227
-
228
-
229
-
230
-
231
-
232
-
233
-
234
-
235
-
236
-
237
-
238
-
239
-
240
-
241
-
242
-
243
-
244
-
245
-
246
-
247
-
248
-
249
-
250
-
251
-
252
-
253
 |
 |

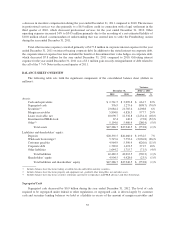
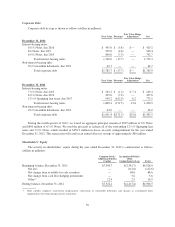
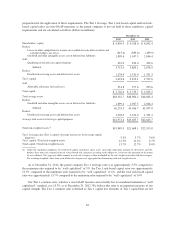
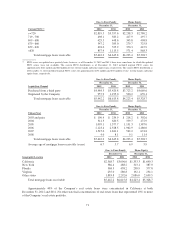
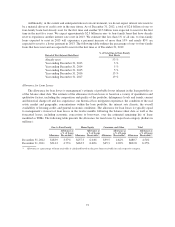
preparation for the application of these requirements. The Tier 1 leverage, Tier 1 risk-based capital and total risk-
based capital ratios are non-GAAP measures as the parent company is not yet held to these regulatory capital
requirements and are calculated as follows (dollars in millions):
December 31,
2012 2011 2010
Shareholders’ equity $ 4,904.5 $ 4,928.0 $ 4,052.4
Deduct:
Losses in other comprehensive income on available-for-sale debt securities and
cash flow hedges, net of tax (315.4) (389.6) (439.9)
Goodwill and other intangible assets, net of deferred tax liabilities 1,899.4 1,947.5 2,046.4
Add:
Qualifying restricted core capital elements 433.0 433.0 433.0
Subtotal 3,753.5 3,803.1 2,878.9
Deduct:
Disallowed servicing assets and deferred tax assets 1,278.9 1,331.0 1,351.3
Tier 1 capital 2,474.6 2,472.1 1,527.6
Add:
Allowable allowance for loan losses 251.8 277.6 295.6
Total capital $ 2,726.4 $ 2,749.7 $ 1,823.2
Total average assets $48,152.7 $46,964.2 $46,043.4
Deduct:
Goodwill and other intangible assets, net of deferred tax liabilities 1,899.4 1,947.5 2,046.4
Subtotal 46,253.3 45,016.7 43,997.0
Deduct:
Disallowed servicing assets and deferred tax assets 1,278.9 1,331.0 1,351.3
Average total assets for leverage capital purposes $44,974.4 $43,685.7 $42,645.7
Total risk-weighted assets(1) $19,849.9 $21,668.1 $22,915.8
Tier 1 leverage ratio (Tier 1 capital / Average total assets for leverage capital
purposes) 5.5% 5.7% 3.6%
Tier 1 capital / Total risk-weighted assets 12.5% 11.4% 6.7%
Total capital / Total risk-weighted assets 13.7% 12.7% 8.0%
(1) Under the regulatory guidelines for risk-based capital, on-balance sheet assets and credit equivalent amounts of derivatives and off-
balance sheet items are assigned to one of several broad risk categories according to the obligor or, if relevant, the guarantor or the nature
of any collateral. The aggregate dollar amount in each risk category is then multiplied by the risk weight associated with that category.
The resulting weighted values from each of the risk categories are aggregated for determining total risk-weighted assets.
As of December 31, 2012, the parent company Tier 1 leverage ratio was approximately 5.5% compared to
the minimum ratio required to be “well capitalized” of 5%, the Tier 1 risk-based capital ratio was approximately
12.5% compared to the minimum ratio required to be “well capitalized” of 6%, and the total risk-based capital
ratio was approximately 13.7% compared to the minimum ratio required to be “well capitalized” of 10%.
Our Tier 1 common ratio, which is a non-GAAP measure and currently has no mandated minimum or “well
capitalized” standard, was 10.3% as of December 31, 2012. We believe this ratio is an important measure of our
capital strength. The Tier 1 common ratio is defined as Tier 1 capital less elements of Tier 1 capital that are not
62