eTrade 2012 Annual Report Download - page 81
Download and view the complete annual report
Please find page 81 of the 2012 eTrade annual report below. You can navigate through the pages in the report by either clicking on the pages listed below, or by using the keyword search tool below to find specific information within the annual report.-
 1
1 -
2
-
3
-
4
-
5
-
6
-
7
-
8
-
9
-
10
-
11
-
12
-
13
-
14
-
15
-
16
-
17
-
18
-
19
-
20
-
21
-
22
-
23
-
24
-
25
-
26
-
27
-
28
-
29
-
30
-
31
-
32
-
33
-
34
-
35
-
36
-
37
-
38
-
39
-
40
-
41
-
42
-
43
-
44
-
45
-
46
-
47
-
48
-
49
-
50
-
51
-
52
-
53
-
54
-
55
-
56
-
57
-
58
-
59
-
60
-
61
-
62
-
63
-
64
-
65
-
66
-
67
-
68
-
69
-
70
-
 71
71 -
 72
72 -
 73
73 -
 74
74 -
 75
75 -
 76
76 -
 77
77 -
 78
78 -
 79
79 -
 80
80 -
 81
81 -
 82
82 -
 83
83 -
 84
84 -
 85
85 -
 86
86 -
 87
87 -
 88
88 -
 89
89 -
 90
90 -
 91
91 -
92
-
93
-
94
-
95
-
96
-
97
-
98
-
99
-
100
-
101
-
102
-
103
-
104
-
105
-
106
-
107
-
108
-
109
-
110
-
111
-
112
-
113
-
114
-
115
-
116
-
117
-
118
-
119
-
120
-
121
-
122
-
123
-
124
-
125
-
126
-
127
-
128
-
129
-
130
-
131
-
132
-
133
-
134
-
135
-
136
-
137
-
138
-
139
-
140
-
141
-
142
-
143
-
144
-
145
-
146
-
147
-
148
-
149
-
150
-
151
-
152
-
153
-
154
-
155
-
156
-
157
-
158
-
159
-
160
-
161
-
162
-
163
-
164
-
165
-
166
-
167
-
168
-
169
-
170
-
171
-
172
-
173
-
174
-
175
-
176
-
177
-
178
-
179
-
180
-
181
-
182
-
183
-
184
-
185
-
186
-
187
-
188
-
189
-
190
-
191
-
192
-
193
-
194
-
195
-
196
-
197
-
198
-
199
-
200
-
201
-
202
-
203
-
204
-
205
-
206
-
207
-
208
-
209
-
210
-
211
-
212
-
213
-
214
-
215
-
216
-
217
-
218
-
219
-
220
-
221
-
222
-
223
-
224
-
225
-
226
-
227
-
228
-
229
-
230
-
231
-
232
-
233
-
234
-
235
-
236
-
237
-
238
-
239
-
240
-
241
-
242
-
243
-
244
-
245
-
246
-
247
-
248
-
249
-
250
-
251
-
252
-
253
 |
 |

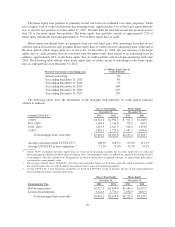
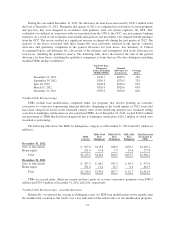
One- to four-family loans delinquent 90-179 days declined $41.5 million to $94.7 million and home equity
loans delinquent 90-179 days declined $35.5 million to $64.2 million due to both improving credit trends and the
additional charge-offs recorded as a result of the completion of the evaluation of certain programs and practices,
as previously discussed. The review resulted in a significant increase in charge-offs during the first quarter of
2012, which also decreased the loans receivable balance.
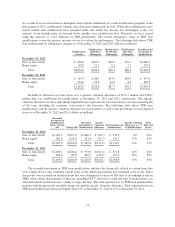
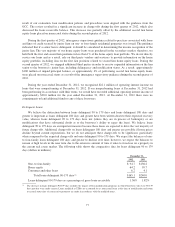
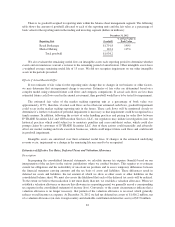
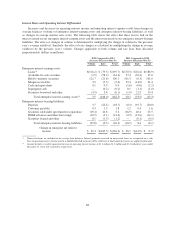
In addition to nonperforming assets, we monitor loans in which a borrower’s current credit history casts
doubt on their ability to repay a loan. We classify loans as special mention when they are between 30 and 89 days
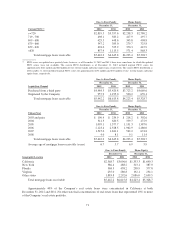
past due. The following table shows the comparative data for special mention loans (dollars in millions):
December 31,
2012 2011
One- to four-family $233.8 $294.8
Home equity 89.3 154.6
Consumer and other loans 19.1 17.7
Total special mention loans(1) $342.2 $467.1
Special mention loans receivable as a percentage of gross loans receivable 3.23% 3.55%
(1) The decrease in special mention loans includes the impact of loan modification programs in which borrowers who were 30 to 89 days
past due were made current. Loans modified as TDRs are accounted for as nonaccrual loans at the time of modification and return to
accrual status after six consecutive payments are made in accordance with the modified terms.
The trend in special mention loan balances is generally indicative of the expected trend for charge-offs in
future periods, as these loans have a greater propensity to migrate into nonaccrual status and ultimately charge-
off. One- to four-family loans are generally secured in a first lien position by real estate assets, reducing the
potential loss when compared to an unsecured loan. Home equity loans are generally secured by real estate
assets; however, the majority of these loans are secured in a second lien position, which substantially increases
the potential loss when compared to a first lien position. The loss severity of our second lien home equity loans is
approximately 95%.
During the year ended December 31, 2012, special mention loans decreased by $124.9 million to $342.2
million and are down 67% from their peak of $1.0 billion as of December 31, 2008. This decrease was largely
due to both improving credit trends and the additional charge-offs recorded as a result of the completion of the
evaluation of certain programs and practices, as previously discussed. The review resulted in a significant
increase in charge-offs during the first quarter of 2012, which also decreased the loans receivable balance. While
the level of special mention loans can fluctuate significantly in any given period, we believe the continued
decrease is an encouraging sign regarding the future credit performance of the mortgage loan portfolio.
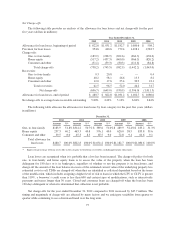
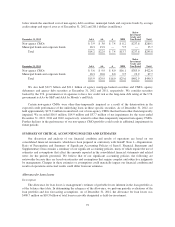
Securities
We focus primarily on security type and credit rating to monitor credit risk in our securities portfolios. We
believe our highest concentration of credit risk within this portfolio is the non-agency CMO portfolio. The table
78