eTrade 2012 Annual Report Download - page 39
Download and view the complete annual report
Please find page 39 of the 2012 eTrade annual report below. You can navigate through the pages in the report by either clicking on the pages listed below, or by using the keyword search tool below to find specific information within the annual report.-
 1
1 -
2
-
3
-
4
-
5
-
6
-
7
-
8
-
9
-
10
-
11
-
12
-
13
-
14
-
15
-
16
-
17
-
18
-
19
-
20
-
21
-
22
-
23
-
24
-
25
-
26
-
27
-
28
-
 29
29 -
 30
30 -
 31
31 -
 32
32 -
 33
33 -
 34
34 -
 35
35 -
 36
36 -
 37
37 -
 38
38 -
 39
39 -
 40
40 -
 41
41 -
 42
42 -
 43
43 -
 44
44 -
 45
45 -
 46
46 -
 47
47 -
 48
48 -
 49
49 -
50
-
51
-
52
-
53
-
54
-
55
-
56
-
57
-
58
-
59
-
60
-
61
-
62
-
63
-
64
-
65
-
66
-
67
-
68
-
69
-
70
-
71
-
72
-
73
-
74
-
75
-
76
-
77
-
78
-
79
-
80
-
81
-
82
-
83
-
84
-
85
-
86
-
87
-
88
-
89
-
90
-
91
-
92
-
93
-
94
-
95
-
96
-
97
-
98
-
99
-
100
-
101
-
102
-
103
-
104
-
105
-
106
-
107
-
108
-
109
-
110
-
111
-
112
-
113
-
114
-
115
-
116
-
117
-
118
-
119
-
120
-
121
-
122
-
123
-
124
-
125
-
126
-
127
-
128
-
129
-
130
-
131
-
132
-
133
-
134
-
135
-
136
-
137
-
138
-
139
-
140
-
141
-
142
-
143
-
144
-
145
-
146
-
147
-
148
-
149
-
150
-
151
-
152
-
153
-
154
-
155
-
156
-
157
-
158
-
159
-
160
-
161
-
162
-
163
-
164
-
165
-
166
-
167
-
168
-
169
-
170
-
171
-
172
-
173
-
174
-
175
-
176
-
177
-
178
-
179
-
180
-
181
-
182
-
183
-
184
-
185
-
186
-
187
-
188
-
189
-
190
-
191
-
192
-
193
-
194
-
195
-
196
-
197
-
198
-
199
-
200
-
201
-
202
-
203
-
204
-
205
-
206
-
207
-
208
-
209
-
210
-
211
-
212
-
213
-
214
-
215
-
216
-
217
-
218
-
219
-
220
-
221
-
222
-
223
-
224
-
225
-
226
-
227
-
228
-
229
-
230
-
231
-
232
-
233
-
234
-
235
-
236
-
237
-
238
-
239
-
240
-
241
-
242
-
243
-
244
-
245
-
246
-
247
-
248
-
249
-
250
-
251
-
252
-
253
 |
 |

EARNINGS OVERVIEW
2012 Compared to 2011
We incurred a net loss of $112.6 million, or $(0.39) per diluted share, on total net revenue of $1.9 billion for
the year ended December 31, 2012. The net loss for the year ended December 31, 2012 was primarily the result
of losses of $256.9 million from the early extinguishment of all the 12
1
⁄
2
% Springing lien notes and 7
7
⁄
8
% Notes
during 2012.
Net operating interest income decreased 11% to $1.1 billion for the year ended December 31, 2012
compared to 2011, which was driven primarily by a decrease in enterprise net interest spread during 2012.
Commissions, fees and service charges, principal transactions and other revenue decreased 11% to
$630.9 million for the year ended December 31, 2012, compared to 2011, which was driven primarily by a
decrease in trading activity during 2012. In addition, gains on loans and securities, net increased 67% to $200.4
million for the year ended December 31, 2012 compared to 2011. We recognized additional gains from securities
sold as a result of our continued deleveraging efforts, primarily related to a reduction in wholesale funding
obligations, which resulted in losses on early extinguishment of debt of $78.3 million during the year ended
December 31, 2012.
Provision for loan losses declined 20% to $354.6 million for the year ended December 31, 2012 compared to
2011. The decline was driven primarily by improving credit trends and loan portfolio run-off, offset by an increase
of $50 million related to charge-offs associated with newly identified bankruptcy filings during the third quarter of
2012. Total operating expenses decreased 6% to $1.2 billion for the year ended December 31, 2012 compared to
2011. This decrease was driven primarily by decreases in clearing and servicing and other operating expenses,
partially offset by an increase in compensation and benefits expense for the year ended December 31, 2012.
The following sections describe in detail the changes in key operating factors and other changes and events
that affected net revenue, provision for loan losses, operating expense, other income (expense) and income tax
expense (benefit).
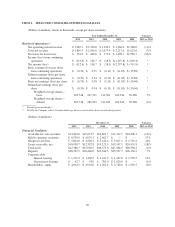
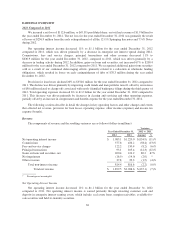
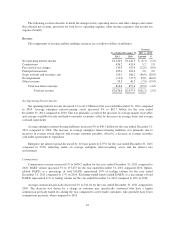
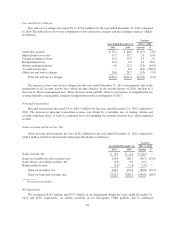
Revenue
The components of revenue and the resulting variances are as follows (dollars in millions):
Variance
Year Ended December 31, 2012 vs. 2011
2012 2011 Amount %
Net operating interest income $ 1,085.1 $1,220.0 $(134.9) (11)%
Commissions 377.8 436.2 (58.4) (13)%
Fees and service charges 122.2 130.4 (8.2) (6)%
Principal transactions 93.1 105.4 (12.3) (12)%
Gains on loans and securities, net 200.4 120.2 80.2 67%
Net impairment (16.9) (14.9) (2.0) *
Other revenues 37.8 39.3 (1.5) (4)%
Total non-interest income 814.4 816.6 (2.2) (0)%
Total net revenue $ 1,899.5 $2,036.6 $(137.1) (7)%
* Percentage not meaningful.
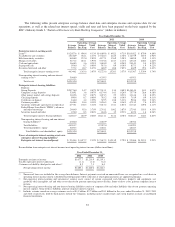
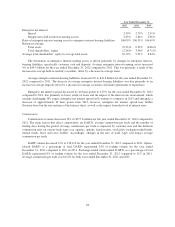
Net Operating Interest Income
Net operating interest income decreased 11% to $1.1 billion for the year ended December 31, 2012
compared to 2011. Net operating interest income is earned primarily through investing customer cash and
deposits in enterprise interest-earning assets, which include: real estate loans, margin receivables, available-for-
sale securities and held-to-maturity securities.
36