American Airlines 2008 Annual Report Download - page 113
Download and view the complete annual report
Please find page 113 of the 2008 American Airlines annual report below. You can navigate through the pages in the report by either clicking on the pages listed below, or by using the keyword search tool below to find specific information within the annual report.-
 1
1 -
2
-
3
-
4
-
5
-
6
-
7
-
8
-
9
-
10
-
11
-
12
-
13
-
14
-
15
-
16
-
17
-
18
-
19
-
20
-
21
-
22
-
23
-
24
-
25
-
26
-
27
-
28
-
29
-
30
-
31
-
32
-
33
-
34
-
35
-
36
-
37
-
38
-
39
-
40
-
41
-
42
-
43
-
44
-
45
-
46
-
47
-
48
-
49
-
50
-
51
-
52
-
53
-
54
-
55
-
56
-
57
-
58
-
59
-
60
-
61
-
62
-
63
-
64
-
65
-
66
-
67
-
68
-
69
-
70
-
71
-
72
-
73
-
74
-
75
-
76
-
77
-
78
-
79
-
80
-
81
-
82
-
83
-
84
-
85
-
86
-
87
-
88
-
89
-
90
-
91
-
92
-
93
-
94
-
95
-
96
-
97
-
98
-
99
-
100
-
101
-
102
-
 103
103 -
 104
104 -
 105
105 -
 106
106 -
 107
107 -
 108
108 -
 109
109 -
 110
110 -
 111
111 -
 112
112 -
 113
113 -
 114
114
 |
 |
ADDITIONAL INFORMATION—(Continued)
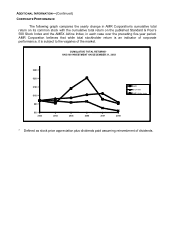
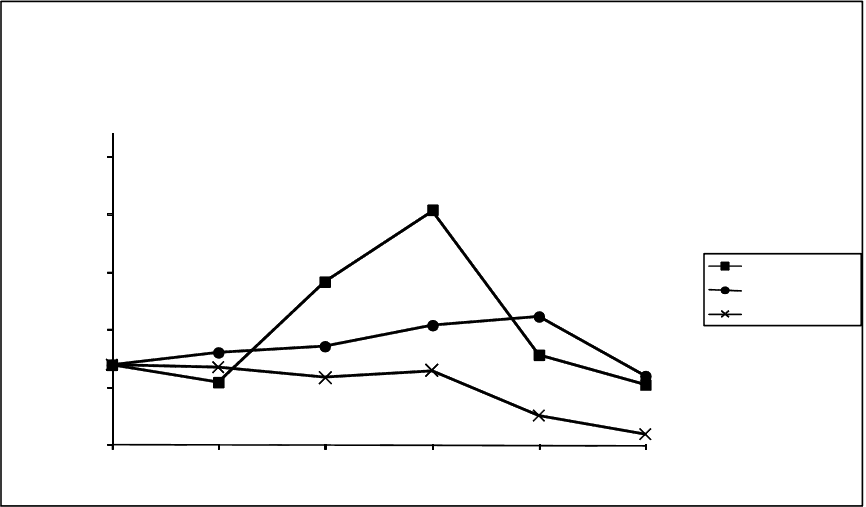
CORPORATE PERFORMANCE
The following graph compares the yearly change in AMR Corporation’s cumulative total
return on its common stock with the cumulative total return on the published Standard & Poor’s
500 Stock Index and the AMEX Airline Index, in each case over the preceding five-year period.
AMR Corporation believes that while total stockholder return is an indicator of corporate
performance, it is subject to the vagaries of the market.
* Defined as stock price appreciation plus dividends paid assuming reinvestment of dividends.
$30
$80
$130
$180
$230
$280
2003
2004
2005
2006
2007
2008
CUMULATIVE TOTAL RETURNS*
ON $100 INVESTMENT ON DECEMBER 31, 2003
AMR
S & P 500
AMEX Airline Index