American Airlines 2008 Annual Report Download - page 41
Download and view the complete annual report
Please find page 41 of the 2008 American Airlines annual report below. You can navigate through the pages in the report by either clicking on the pages listed below, or by using the keyword search tool below to find specific information within the annual report.-
 1
1 -
2
-
3
-
4
-
5
-
6
-
7
-
8
-
9
-
10
-
11
-
12
-
13
-
14
-
15
-
16
-
17
-
18
-
19
-
20
-
21
-
22
-
23
-
24
-
25
-
26
-
27
-
28
-
29
-
30
-
 31
31 -
 32
32 -
 33
33 -
 34
34 -
 35
35 -
 36
36 -
 37
37 -
 38
38 -
 39
39 -
 40
40 -
 41
41 -
 42
42 -
 43
43 -
 44
44 -
 45
45 -
 46
46 -
 47
47 -
 48
48 -
 49
49 -
 50
50 -
 51
51 -
52
-
53
-
54
-
55
-
56
-
57
-
58
-
59
-
60
-
61
-
62
-
63
-
64
-
65
-
66
-
67
-
68
-
69
-
70
-
71
-
72
-
73
-
74
-
75
-
76
-
77
-
78
-
79
-
80
-
81
-
82
-
83
-
84
-
85
-
86
-
87
-
88
-
89
-
90
-
91
-
92
-
93
-
94
-
95
-
96
-
97
-
98
-
99
-
100
-
101
-
102
-
103
-
104
-
105
-
106
-
107
-
108
-
109
-
110
-
111
-
112
-
113
-
114
 |
 |

38
Revenues
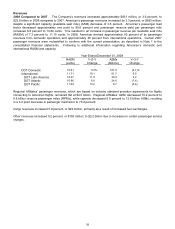
2008 Compared to 2007 The Company’s revenues increased approximately $831 million, or 3.6 percent, to
$23.8 billion in 2008 compared to 2007. American’s passenger revenues increased by 3.3 percent, or $583 million,
despite a significant capacity (available seat mile) (ASM) decrease of 3.8 percent. American’s passenger load
factor decreased approximately one point to 80.6 percent and passenger revenue yield per passenger mile
increased 8.6 percent to 13.84 cents. This resulted in an increase in passenger revenue per available seat mile
(RASM) of 7.3 percent to 11.15 cents. In 2008, American derived approximately 60 percent of its passenger
revenues from domestic operations and approximately 40 percent from international operations. Certain 2007
passenger revenues were reclassified to conform with the current presentation, as described in Note 1 to the
consolidated financial statements. Following is additional information regarding American’s domestic and
international RASM and capacity:
Year Ended December 31, 2008
RASM
(cents)
Y-O-Y
Change
ASMs
(billions)
Y-O-Y
Change
DOT Domestic
10.81
5.5%
101.9
(6.1)%
International
11.71
10.1
61.7
0.5
DOT Latin America
12.47
11.9
30.4
2.2
DOT Atlantic
10.96
6.6
24.6
(1.4)
DOT Pacific
11.04
13.2
6.7
(0.4)
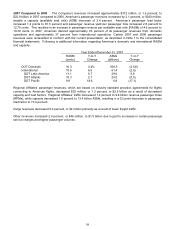
Regional Affiliates’ passenger revenues, which are based on industry standard proration agreements for flights
connecting to American flights, remained flat at $2.5 billion. Regional Affiliates’ traffic decreased 10.2 percent to
8.8 billion revenue passenger miles (RPMs), while capacity decreased 6.0 percent to 12.6 billion ASMs, resulting
in a 3.2 point decrease in passenger load factor to 70.2 percent.
Cargo revenues increased 5.9 percent, or $49 million, primarily as a result of increased fuel surcharges.
Other revenues increased 9.2 percent, or $183 million, to $2.2 billion due to increases in certain passenger service
charges.