American Airlines 2008 Annual Report Download - page 32
Download and view the complete annual report
Please find page 32 of the 2008 American Airlines annual report below. You can navigate through the pages in the report by either clicking on the pages listed below, or by using the keyword search tool below to find specific information within the annual report.-
 1
1 -
2
-
3
-
4
-
5
-
6
-
7
-
8
-
9
-
10
-
11
-
12
-
13
-
14
-
15
-
16
-
17
-
18
-
19
-
20
-
21
-
 22
22 -
 23
23 -
 24
24 -
 25
25 -
 26
26 -
 27
27 -
 28
28 -
 29
29 -
 30
30 -
 31
31 -
 32
32 -
 33
33 -
 34
34 -
 35
35 -
 36
36 -
 37
37 -
 38
38 -
 39
39 -
 40
40 -
 41
41 -
 42
42 -
43
-
44
-
45
-
46
-
47
-
48
-
49
-
50
-
51
-
52
-
53
-
54
-
55
-
56
-
57
-
58
-
59
-
60
-
61
-
62
-
63
-
64
-
65
-
66
-
67
-
68
-
69
-
70
-
71
-
72
-
73
-
74
-
75
-
76
-
77
-
78
-
79
-
80
-
81
-
82
-
83
-
84
-
85
-
86
-
87
-
88
-
89
-
90
-
91
-
92
-
93
-
94
-
95
-
96
-
97
-
98
-
99
-
100
-
101
-
102
-
103
-
104
-
105
-
106
-
107
-
108
-
109
-
110
-
111
-
112
-
113
-
114
 |
 |
29
The Company recorded a net loss of $2.1 billion in 2008 compared to net earnings of $504 million in 2007. The
Company’s 2008 results include an impairment charge of $1.1 billion to write the McDonnell Douglas MD-80 and
Embraer RJ-135 fleets and certain related long-lived assets down to their estimated fair values, a $71 million
accrual for employee severance costs, and a $33 million expense related to the grounding of leased Airbus A300
aircraft prior to lease expiration (all in connection with announced capacity reductions). Early pilot retirements
resulted in $917 million in total lump sum payments to 517 pilot retirees (approximately $1.8 million per retiree
consisting of payments from Company-funded defined benefit and defined contribution plan trusts) for which the
Company incurred a $103 million settlement charge. The capacity reduction and impairment charges are
described in Note 2 and the pension settlement charge is described in Note 10 to the consolidated financial
statements. In addition, the Company’s 2008 results include the sale of American Beacon for a net gain of $432
million described in Note 14 to the consolidated financial statements.
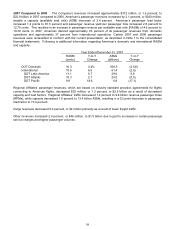
The Company’s 2008 net operating loss also reflects a dramatic year-over-year increase in fuel prices from an
average of $2.13 per gallon in 2007 to an average of $3.03 per gallon in 2008. Fuel expense has become the
Company’s largest single expense category and the price increase resulted in $2.7 billion in incremental year-
over-year fuel expense in 2008 (based on the year-over-year increase in the average price per gallon multiplied by
gallons consumed, inclusive of the impact of fuel hedging). Although fuel prices have abated somewhat from the
record prices recorded in July 2008, fuel prices are still extremely volatile by historical standards.
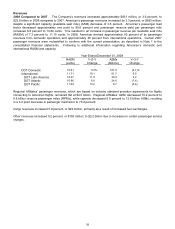
The significant rise in fuel price was partially offset by higher unit revenues (passenger revenue per available seat
mile). Mainline passenger unit revenues increased 7.3 percent for the year due to an 8.6 percent increase in
passenger yield (passenger revenue per passenger mile) partially offset by an approximately one point load factor
decrease compared to 2007. Although passenger yield showed year-over-year improvement, passenger yield
remains essentially flat with the levels set in 2000 despite cumulative inflation of approximately 25 percent over the
same time frame. The Company believes this is the result of a fragmented industry with numerous competitors
and excess capacity, increased low cost carrier competition, increased price competition due to the internet, and
other factors. Since deregulation in 1978, the Company’s passenger yield has increased 85 percent, while the
Consumer Price Index (CPI), as measured by the US Department of Labor Bureau of Labor Statistics, has grown
by 226 percent. The Company believes increases in passenger yield will continue to significantly lag CPI
indefinitely.
The Company’s efforts to drive continuous revenue and cost improvement under the Turnaround Plan are
ongoing. This plan was established in 2003 and is the Company’s strategic framework for achieving sustained
profitability and has four tenets: (i) lower costs to compete, (ii) fly smart – give customers what they value, (iii) pull
together, win together and (iv) build a financial foundation.
Although the Company’s cost per available seat mile increased from 11.54 cents in 2002 to 14.57 cents in 2008,
the fuel component of unit cost increased from 1.43 cents to 5.12 cents over the same period. All other
components of unit cost decreased from 10.11 cents in 2002 to 9.45 cents in 2008, or 6.5 percent. However, the
Company’s 2008 unit costs excluding fuel were greater than in 2007, and are expected to increase in 2009
compared to 2008. Factors driving the 2009 increase include increased defined benefit pension expenses and
retiree medical and other expenses (due to the stock market decline), and cost pressures associated with the
Company’s previously announced capacity reductions and dependability initiatives.
The Company has also implemented numerous efforts to find additional revenue sources and increase existing
ones. In addition to improving core passenger and cargo revenues, these efforts have contributed to an increase
in Other revenue from $1.4 billion (as reclassified by change in presentation for certain passenger revenues – see
Note 1 to the consolidated financial statements) in 2002 to $2.2 billion in 2008. Examples of new revenue sources
over this period include checked baggage service charges, flight change service charges, onboard food sales,
single day passes for AAdmirals Club admission, reservations ticketing service charges, First Class upgrades on
day of departure, and numerous other initiatives.