American Airlines 2008 Annual Report Download - page 45
Download and view the complete annual report
Please find page 45 of the 2008 American Airlines annual report below. You can navigate through the pages in the report by either clicking on the pages listed below, or by using the keyword search tool below to find specific information within the annual report.-
 1
1 -
2
-
3
-
4
-
5
-
6
-
7
-
8
-
9
-
10
-
11
-
12
-
13
-
14
-
15
-
16
-
17
-
18
-
19
-
20
-
21
-
22
-
23
-
24
-
25
-
26
-
27
-
28
-
29
-
30
-
31
-
32
-
33
-
34
-
 35
35 -
 36
36 -
 37
37 -
 38
38 -
 39
39 -
 40
40 -
 41
41 -
 42
42 -
 43
43 -
 44
44 -
 45
45 -
 46
46 -
 47
47 -
 48
48 -
 49
49 -
 50
50 -
 51
51 -
 52
52 -
 53
53 -
 54
54 -
 55
55 -
56
-
57
-
58
-
59
-
60
-
61
-
62
-
63
-
64
-
65
-
66
-
67
-
68
-
69
-
70
-
71
-
72
-
73
-
74
-
75
-
76
-
77
-
78
-
79
-
80
-
81
-
82
-
83
-
84
-
85
-
86
-
87
-
88
-
89
-
90
-
91
-
92
-
93
-
94
-
95
-
96
-
97
-
98
-
99
-
100
-
101
-
102
-
103
-
104
-
105
-
106
-
107
-
108
-
109
-
110
-
111
-
112
-
113
-
114
 |
 |

42
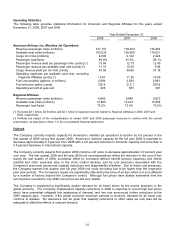
Operating Statistics
The following table provides statistical information for American and Regional Affiliates for the years ended
December 31, 2008, 2007 and 2006.
Year Ended December 31,
2008
2007
2006
American Airlines, Inc. Mainline Jet Operations
Revenue passenger miles (millions)
131,757
138,453
139,454
Available seat miles (millions)
163,532
169,906
174,021
Cargo ton miles (millions)
2,005
2,122
2,224
Passenger load factor
80.6%
81.5%
80.1%
Passenger revenue yield per passenger mile (cents) (^)
13.84
12.75
12.40
Passenger revenue per available seat mile (cents) (^)
11.15
10.39
9.94
Cargo revenue yield per ton mile (cents)
43.59
38.86
37.18
Operating expenses per available seat mile, excluding
Regional Affiliates (cents) (*)
13.87
11.38
10.90
Fuel consumption (gallons, in millions)
2,694
2,834
2,881
Fuel price per gallon (cents)
302.6
212.1
200.8
Operating aircraft at year-end
626
655
697
Regional Affiliates
Revenue passenger miles (millions)
8,846
9,848
9,972
Available seat miles (millions)
12,603
13,414
13,554
Passenger load factor
70.2%
73.4%
73.6%
(*) Excludes $3.1 billion, $2.8 billion and $2.7 billion of expense incurred related to Regional Affiliates in 2008, 2007 and
2006, respectively.
(^) Reflects the impact of the reclassification of certain 2007 and 2006 passenger revenues to conform with the current
presentation, as described in Note 1 to the consolidated financial statements.
Outlook
The Company currently expects capacity for American’s mainline jet operations to decline by 8.5 percent in the
first quarter of 2009 versus first quarter 2008. American’s mainline capacity for the full year 2009 is expected to
decrease approximately 6.5 percent from 2008 with a 9.0 percent reduction in domestic capacity and more than a
2.5 percent decrease in international capacity.
The Company currently expects first quarter 2009 mainline unit costs to decrease approximately 2.9 percent year
over year. The first quarter 2009 and full year 2009 unit cost expectations reflect the reduction in the cost of fuel
during the last quarter of 2008, somewhat offset by increased defined benefit pension expenses and retiree
medical and other expenses (due to the stock market decline), and by cost pressures associated with the
Company’s previously announced capacity reductions and dependability initiatives. Due to these cost pressures,
the Company expects first quarter and full year 2009 unit costs excluding fuel to be higher than the respective
prior year periods. The Company’s results are significantly affected by the price of jet fuel, which is in turn affected
by a number of factors beyond the Company’s control. Although fuel prices have abated somewhat from the
record prices recorded in July 2008, fuel prices are still very volatile.
The Company is experiencing significantly weaker demand for air travel driven by the severe downturn in the
global economy. The Company implemented capacity reductions in 2008 in response to record high fuel prices
which have somewhat mitigated this weakening of demand, and has now announced further reductions to the
2009 capacity plan. However, if the global economic downturn persists or worsens, demand for air travel may
continue to weaken. No assurance can be given that capacity reductions or other steps we may take will be
adequate to offset the effects of reduced demand.