American Express 2006 Annual Report Download - page 100
Download and view the complete annual report
Please find page 100 of the 2006 American Express annual report below. You can navigate through the pages in the report by either clicking on the pages listed below, or by using the keyword search tool below to find specific information within the annual report.-
 1
1 -
2
-
3
-
4
-
5
-
6
-
7
-
8
-
9
-
10
-
11
-
12
-
13
-
14
-
15
-
16
-
17
-
18
-
19
-
20
-
21
-
22
-
23
-
24
-
25
-
26
-
27
-
28
-
29
-
30
-
31
-
32
-
33
-
34
-
35
-
36
-
37
-
38
-
39
-
40
-
41
-
42
-
43
-
44
-
45
-
46
-
47
-
48
-
49
-
50
-
51
-
52
-
53
-
54
-
55
-
56
-
57
-
58
-
59
-
60
-
61
-
62
-
63
-
64
-
65
-
66
-
67
-
68
-
69
-
70
-
71
-
72
-
73
-
74
-
75
-
76
-
77
-
78
-
79
-
80
-
81
-
82
-
83
-
84
-
85
-
86
-
87
-
88
-
89
-
 90
90 -
 91
91 -
 92
92 -
 93
93 -
 94
94 -
 95
95 -
 96
96 -
 97
97 -
 98
98 -
 99
99 -
 100
100 -
 101
101 -
 102
102 -
 103
103 -
 104
104 -
 105
105 -
 106
106 -
 107
107 -
 108
108 -
 109
109 -
 110
110 -
111
-
112
-
113
-
114
-
115
-
116
 |
 |

[ 98 ]
notes to consolidated fi nancial statements
american express company
NOTE 14 SIGNIFICANT CREDIT
CONCENTRATIONS
Credit concentrations arise when customers operate
in similar industries, economic sectors or geographic
regions. The Company’s customers operate in diverse
industries, economic sectors and geographic regions.
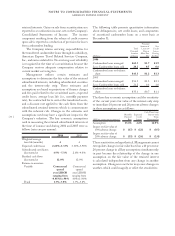
The following table represents the Company’s
maximum credit exposure by industry, including the
credit exposure associated with derivative financial
instruments, at December 31:
(Billions, except percentages) 2006 2005
Financial institutions(a) $ 18.5 $ 16.7
On-balance sheet 17.0 15.6
Off-balance sheet 1.5 1.1
Individuals, including cardmember
receivables and loans(b) 342.9 280.4
On-balance sheet 78.2 66.6
Off-balance sheet 264.7 213.8
U.S. Government and agencies(c) 11.9 12.2
On-balance sheet 11.9 12.2
All other 14.9 14.2
On-balance sheet 14.8 14.1
Off-balance sheet 0.1 0.1
Tota l (d) $388.2 $323.5
Composition:
On-balance sheet 31% 34%
Off-balance sheet 69% 66%
Tota l 100% 100%
(a) Financial institutions primarily include banks, broker-dealers,
insurance companies and savings and loan associations.
(b) Because charge card products have no preset spending limit,
the associated credit limit on cardmember receivables is not
quantifiable. Therefore, the quantified credit amount only includes
the credit line available on cardmember loans. The unused lines
aggregating $264 billion and $213 billion in 2006 and 2005,
respectively, represent commitments of the Company.
(c) U.S. Government and agencies represent the U.S. Government
and its agencies, states and municipalities, and quasi-
government agencies.
(d) Certain distinctions between categories require management
judgment.
As disclosed in the table above, at December 31, 2006, the
Company’s most significant concentration of credit risk
was with individuals, including cardmember receivables
and loans. These amounts are generally advanced on an
unsecured basis. However, the Company reviews each
potential customer’s credit application and evaluates the
applicant’s financial history and ability and willingness
to repay.
EXPOSURE TO AIRLINE INDUSTRY
Historically, the Company has not experienced
significant revenue declines when a particular airline
scales back or ceases operations due to a bankruptcy
or other financial challenges. This is because volumes
generated by that airline are typically shifted to other
participants in the industry that accept the Company’s
card products. Nonetheless, the Company is exposed to
business and credit risk in the airline industry primarily
through business arrangements where the Company
has remitted payment to the airline for a cardmember
purchase of tickets that have not yet been used or
“flown.” In the event that the cardmember is not able to
use the ticket and the Company, based on the facts and
circumstances, credits the cardmember for the unused
ticket, this business arrangement creates a potential
exposure for the Company. This credit exposure is
included in the maximum amount of undiscounted future
payments disclosed in Note 11. Historically, this type of
exposure has not generated any significant losses for the
Company because an airline operating under bankruptcy
protection needs to continue accepting credit and charge
cards and honoring requests for credits and refunds in
the ordinary course of its business. Typically, as an
airline’s financial situation deteriorates, the Company
delays payment to the airline thereby increasing cash
withheld to protect the Company in the event the airline
is liquidated. The Company’s goal in these distressed
situations is to hold sufficient cash over time to ensure
that upon liquidation, the cash held is equivalent to the
credit exposure related to any unused tickets.
There has been some speculation that there will be
consolidation in the airline industry, both in the United
States and internationally. While the Company would
not expect its merchant relationships to change in the
event of consolidation, it is possible that the Company’s
co-brand relationships might be affected if one of the
Company’s partners merged with an airline that had a
different co-brand partner.
As part of Delta Air Lines’ (Delta) decision to file
for protection under Chapter 11 of the Bankruptcy
Code, the Company lent funds to Delta as part of Delta’s
post-petition, debtor-in-possession financing under the
Bankruptcy Code. At December 31, 2006, the remaining
principal balance was $176 million and is scheduled to be
repaid on a monthly basis through September 2007. This
post-petition facility continues to be structured as an
advance against the Company’s obligations to purchase
Delta SkyMiles rewards points under the Company’s co-
brand and Membership Rewards agreements.