American Express 2006 Annual Report Download - page 88
Download and view the complete annual report
Please find page 88 of the 2006 American Express annual report below. You can navigate through the pages in the report by either clicking on the pages listed below, or by using the keyword search tool below to find specific information within the annual report.-
 1
1 -
2
-
3
-
4
-
5
-
6
-
7
-
8
-
9
-
10
-
11
-
12
-
13
-
14
-
15
-
16
-
17
-
18
-
19
-
20
-
21
-
22
-
23
-
24
-
25
-
26
-
27
-
28
-
29
-
30
-
31
-
32
-
33
-
34
-
35
-
36
-
37
-
38
-
39
-
40
-
41
-
42
-
43
-
44
-
45
-
46
-
47
-
48
-
49
-
50
-
51
-
52
-
53
-
54
-
55
-
56
-
57
-
58
-
59
-
60
-
61
-
62
-
63
-
64
-
65
-
66
-
67
-
68
-
69
-
70
-
71
-
72
-
73
-
74
-
75
-
76
-
77
-
 78
78 -
 79
79 -
 80
80 -
 81
81 -
 82
82 -
 83
83 -
 84
84 -
 85
85 -
 86
86 -
 87
87 -
 88
88 -
 89
89 -
 90
90 -
 91
91 -
 92
92 -
 93
93 -
 94
94 -
 95
95 -
 96
96 -
 97
97 -
 98
98 -
99
-
100
-
101
-
102
-
103
-
104
-
105
-
106
-
107
-
108
-
109
-
110
-
111
-
112
-
113
-
114
-
115
-
116
 |
 |

[ 86 ]
notes to consolidated fi nancial statements
american express company
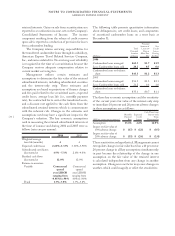
Other revenues include gross realized gains and
losses on sales of securities, as well as other-than-
temporary losses on investments classified as Available-
for-Sale, as noted in the following table for the years
ended December 31:
(Millions) 2006 2005 2004
Gross investment gains from sales
and prepayments (a) $117 $21 $ 23
Gross investment losses from sales
and prepayments (1) (4) (1)
Other-than-temporary impairments —— (10)
Tota l $116 $17 $ 12
(a) Includes $68 million of gains related to a rebalancing program in
the fourth quarter of 2006 to better align the maturity profile of
the Travelers Cheque and Gift Card investment portfolio with its
business liquidity needs.
The table below includes purchases, sales and maturities
of investments classified as Available-for-Sale for the
years ended December 31:
(Billions) 2006 2005
Purchases $18 $12
Sales $6 $4
Maturities $13 $8
The Company entered into securities lending agreements
in June 2006 with other financial institutions. Under
these agreements, certain investment securities are
loaned on an overnight basis to financial institutions and
are secured by collateral equal to at least 102 percent of
the fair market value of the investment securities lent.
Collateral received by the Company can be in the form
of cash or marketable U.S. Treasury or government
agency securities. The Company may only retain or
sell these securities in the event of a borrower default.
The Company’s loaned investment securities continued
to be classified as investments on the Consolidated
Balance Sheet, but are now considered restricted and
pledged assets. The marketable securities received
as collateral are not recorded in the Consolidated
Balance Sheet, as the Company is not permitted to sell
or repledge these securities absent a borrower default.
Fees received from the securities lending transactions
are recorded as other investment and interest income,
net of interest. At December 31, 2006, approximately
$716 million of investment securities were loaned under
these agreements.
TRADING INVESTMENTS
Trading investments consist principally of certain foreign
government bonds and seed money investments in mutual
funds for which the Company’s equity ownership is less
than 20 percent. There were $13 million, $16 million,
and $13 million of realized net gains for 2006, 2005,
and 2004, respectively, related to trading investments
held at each balance sheet date.
NOTE 4 LOANS
Loans at December 31 consisted of:
(Millions) 2006 2005
Cardmember lending $43,306 $ 33,104
International banking:
Consumer and private banking 4,734 4,822
Banks and other institutions 2,470 2,268
Corporate 20 23
Total international banking 7,224 7,113
Other 987 1,681
Total loans — gross 51,517 41,898
Less: Reserve for losses 1,269 1,097
Tota l $50,248 $ 40,801
The following table presents changes in the reserve
for losses:
(Millions) 2006 2005 2004
Balance, January 1 $1,097 $ 1,084 $ 1,121
Provision:
Cardmember lending 1,623 1,349 1,130
International banking and
other 76 32 58
Total provision 1,699 1,381 1,188
Write offs:
Cardmember lending (1,635) (1,449) (1,205)
International banking and
other (104) (67) (114)
Total write offs (1,739) (1,516) (1,319)
Recoveries and other:
Cardmember lending 187 124 49
International banking and
other 25 24 45
Total recoveries and other 212 148 94
Balance, December 31 $1,269 $ 1,097 $ 1,084