American Express 2006 Annual Report Download - page 109
Download and view the complete annual report
Please find page 109 of the 2006 American Express annual report below. You can navigate through the pages in the report by either clicking on the pages listed below, or by using the keyword search tool below to find specific information within the annual report.-
 1
1 -
2
-
3
-
4
-
5
-
6
-
7
-
8
-
9
-
10
-
11
-
12
-
13
-
14
-
15
-
16
-
17
-
18
-
19
-
20
-
21
-
22
-
23
-
24
-
25
-
26
-
27
-
28
-
29
-
30
-
31
-
32
-
33
-
34
-
35
-
36
-
37
-
38
-
39
-
40
-
41
-
42
-
43
-
44
-
45
-
46
-
47
-
48
-
49
-
50
-
51
-
52
-
53
-
54
-
55
-
56
-
57
-
58
-
59
-
60
-
61
-
62
-
63
-
64
-
65
-
66
-
67
-
68
-
69
-
70
-
71
-
72
-
73
-
74
-
75
-
76
-
77
-
78
-
79
-
80
-
81
-
82
-
83
-
84
-
85
-
86
-
87
-
88
-
89
-
90
-
91
-
92
-
93
-
94
-
95
-
96
-
97
-
98
-
 99
99 -
 100
100 -
 101
101 -
 102
102 -
 103
103 -
 104
104 -
 105
105 -
 106
106 -
 107
107 -
 108
108 -
 109
109 -
 110
110 -
 111
111 -
 112
112 -
 113
113 -
 114
114 -
 115
115 -
 116
116
 |
 |

[ 107 ]
notes to consolidated fi nancial statements
american express company
office products, services, and marketing programs and
also manages a global general-purpose charge and credit
card network, which includes both proprietary cards and
cards issued under network partnership agreements.
Corporate & Other consists of corporate functions
and auxiliary businesses, including the Company’s
publishing business, and for 2004, the leasing product
line of the Company’s small business financing unit,
which was sold in 2004.
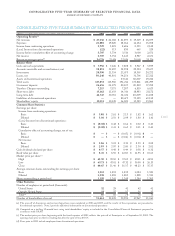
The following table presents certain selected financial
information at December 31, 2006, 2005, and 2004 and
for each of the years then ended.
(Millions, except where indicated)
U.S. Card
Services
International
Card &
Global
Commercial
Services
Global
Network &
Merchant
Services
Corporate
& Other Consolidated
2006
Net revenues $13,955 $9,464 $ 3,161 $ 556 $27,136
Cardmember lending finance charge revenue, net of interest 2,477 808 98 74 3,457
Interest expense 799 500 (183) 120 1,236
Pretax income (loss) from continuing operations 3,305 1,148 1,188 (313) 5,328
Income tax provision (benefit) 1,028 263 409 (101) 1,599
Income (Loss) from continuing operations $2,277 $ 885 $ 779 $(212) $3,729
Total assets (billions) $79.7 $57.7 $ 4.4 $(13.9) $127.9
Total equity (billions) $ 5.0 $ 4.1 $ 1.3 $ 0.1 $ 10.5
2005(a)
Net revenues $11,978 $ 8,905 $ 2,747 $ 438 $24,068
Cardmember lending finance charge revenue, net of interest 1,792 684 67 37 2,580
Interest expense 562 389 (145) 114 920
Pretax income (loss) from continuing operations 2,571 1,093 882 (298) 4,248
Income tax provision (benefit) 755 194 309 (231) 1,027
Income (Loss) from continuing operations $ 1,816 $ 899 $ 573 $ (67) $ 3,221
Total assets (billions) $ 70.3 $ 51.7 $ 4.5 $(12.5) $ 114.0
Total equity (billions) $ 5.1 $ 4.1 $ 1.3 $ — $ 10.5
2004(a)
Net revenues $10,442 $ 8,423 $ 2,531 $ 501 $21,897
Cardmember lending finance charge revenue, net of interest 1,370 640 29 185 2,224
Interest expense 453 280 (108) 189 814
Pretax income (loss) from continuing operations 2,160 1,073 911 (313) 3,831
Income tax provision (benefit) 629 319 332 (135) 1,145
Income (Loss) from continuing operations $ 1,531 $ 754 $ 579 $ (178) $ 2,686
Total assets (billions)(b) $ 58.3 $ 47.9 $ 3.9 $ 84.1 $ 194.2
Total equity (billions) $ 4.5 $ 3.8 $ 1.1 $ 6.6 $ 16.0
(a) Amounts for 2005 and 2004 include certain revenue and expense reclassifications, as well as certain revisions to expenses allocated to segments.
These items had no impact on the Company’s consolidated pretax income from continuing operations, income tax provision, income from
continuing operations or total assets.
(b) Corporate & Other total assets for 2004 include $87.1 billion of assets of discontinued operations.