American Express 2006 Annual Report Download - page 87
Download and view the complete annual report
Please find page 87 of the 2006 American Express annual report below. You can navigate through the pages in the report by either clicking on the pages listed below, or by using the keyword search tool below to find specific information within the annual report.-
 1
1 -
2
-
3
-
4
-
5
-
6
-
7
-
8
-
9
-
10
-
11
-
12
-
13
-
14
-
15
-
16
-
17
-
18
-
19
-
20
-
21
-
22
-
23
-
24
-
25
-
26
-
27
-
28
-
29
-
30
-
31
-
32
-
33
-
34
-
35
-
36
-
37
-
38
-
39
-
40
-
41
-
42
-
43
-
44
-
45
-
46
-
47
-
48
-
49
-
50
-
51
-
52
-
53
-
54
-
55
-
56
-
57
-
58
-
59
-
60
-
61
-
62
-
63
-
64
-
65
-
66
-
67
-
68
-
69
-
70
-
71
-
72
-
73
-
74
-
75
-
76
-
 77
77 -
 78
78 -
 79
79 -
 80
80 -
 81
81 -
 82
82 -
 83
83 -
 84
84 -
 85
85 -
 86
86 -
 87
87 -
 88
88 -
 89
89 -
 90
90 -
 91
91 -
 92
92 -
 93
93 -
 94
94 -
 95
95 -
 96
96 -
 97
97 -
98
-
99
-
100
-
101
-
102
-
103
-
104
-
105
-
106
-
107
-
108
-
109
-
110
-
111
-
112
-
113
-
114
-
115
-
116
 |
 |

[ 85 ]
notes to consolidated fi nancial statements
american express company
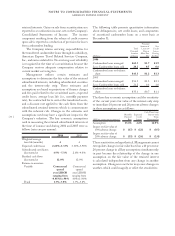
The Company reviews and evaluates investments on a quarterly basis to identify investments that have indications of
possible other-than-temporary impairments. Accordingly, the Company considers the extent to which amortized cost
exceeds fair value and the duration and size of that difference. A key metric in performing this evaluation is the ratio
of fair value to amortized cost. The following table summarizes the unrealized losses of temporary impairments by
ratio of fair value to amortized cost as of December 31, 2006:
(Millions, except
number of securities) Less than 12 months 12 months or more Total
Ratio of Fair Value to
Amortized Cost
Number of
Securities
Fair
Value
Gross
Unrealized
Losses
Number of
Securities
Fair
Value
Gross
Unrealized
Losses
Number of
Securities
Fair
Value
Gross
Unrealized
Losses
90%–100% 618$3,586 $(24) 554$5,734 $(128) 1,172$9,320 $(152)
Less than 90% 123— —6645 (7)18945 (7)
Tota l 741$3,586 $(24) 620$5,779 $(135) 1,361$9,365 $(159)
Unrealized losses may be caused by changes to interest
rates, credit spreads, and specific credit events associated
with individual issuers. Substantially all of the gross
unrealized losses on the securities are attributable to
changes in interest rates. The securities with a fair value
to amortized cost ratio of less than 90 percent consist
primarily of Federal National Mortgage Association
and Federal Home Loan Mortgage Corporation
issued mortgage-backed securities, as well as foreign
government and specific corporate issued bonds. The
securities with a fair value to amortized cost ratio of 90
percent to 100 percent do not contain a concentration
of any one security or type of security. The Company
has the ability and the intent to hold these securities for
a time sufficient to recover the unrealized losses and
expects that contractual principal and interest will be
received on these securities.
The change in net unrealized securities gains
(losses) in other comprehensive (loss) income includes
three components: (i) holding gains (losses), which
are unrealized gains (losses) that arise from changes
in market value of securities that were held during the
period; (ii) reclassification for realized (gains) losses,
which are gains (losses) that were previously unrealized,
but have been recognized in current period net income
due to sales of Available-for-Sale securities; and (iii)
other (losses) gains primarily related to changes in the
mark of the interest-only strip.
Changes in net unrealized securities gains (losses)
for the years ended December 31:
(Millions, net of tax) 2006 2005 2004
Holding losses $(17) $(187) $ (83)
Reclassification for realized gains (75) (11) (35)
Other gains (losses)47 (18) (53)
Net unrealized securities losses in
other comprehensive (loss) income $(45) $(216) $(171)
For 2005 activity, the table above excludes $391 million
of net change in accumulated other comprehensive
loss related to discontinued operations. As of
December 31, 2006 and 2005, net unrealized
securities gains, net of tax, reflected in accumulated
other comprehensive loss were $92 million
and $137 million, respectively.
The following is a distribution of investments
classified as Available-for-Sale by maturity as of
December 31, 2006:
(Millions) Cost
Fair
Value
Due within 1 year $ 3,324 $ 3,314
Due after 1 year through 5 years 6,705 6,689
Due after 5 years through 10 years 788 797
Due after 10 years 5,895 6,054
16,712 16,854
Mortgage and other asset-backed
securities 3,858 3,791
Equity securities 48 50
Tota l $20,618 $20,695
The expected payments on mortgage and other
asset-backed securities may not coincide with their
contractual maturities. Accordingly, these securities,
as well as equity securities, are not included in the
maturities distribution.