American Express 2006 Annual Report Download - page 107
Download and view the complete annual report
Please find page 107 of the 2006 American Express annual report below. You can navigate through the pages in the report by either clicking on the pages listed below, or by using the keyword search tool below to find specific information within the annual report.-
 1
1 -
2
-
3
-
4
-
5
-
6
-
7
-
8
-
9
-
10
-
11
-
12
-
13
-
14
-
15
-
16
-
17
-
18
-
19
-
20
-
21
-
22
-
23
-
24
-
25
-
26
-
27
-
28
-
29
-
30
-
31
-
32
-
33
-
34
-
35
-
36
-
37
-
38
-
39
-
40
-
41
-
42
-
43
-
44
-
45
-
46
-
47
-
48
-
49
-
50
-
51
-
52
-
53
-
54
-
55
-
56
-
57
-
58
-
59
-
60
-
61
-
62
-
63
-
64
-
65
-
66
-
67
-
68
-
69
-
70
-
71
-
72
-
73
-
74
-
75
-
76
-
77
-
78
-
79
-
80
-
81
-
82
-
83
-
84
-
85
-
86
-
87
-
88
-
89
-
90
-
91
-
92
-
93
-
94
-
95
-
96
-
 97
97 -
 98
98 -
 99
99 -
 100
100 -
 101
101 -
 102
102 -
 103
103 -
 104
104 -
 105
105 -
 106
106 -
 107
107 -
 108
108 -
 109
109 -
 110
110 -
 111
111 -
 112
112 -
 113
113 -
 114
114 -
 115
115 -
 116
116
 |
 |

[ 105 ]
notes to consolidated fi nancial statements
american express company
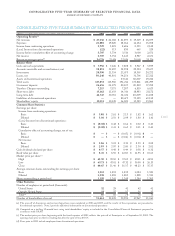
NOTE 17 INCOME TAXES
The components of income tax provision included in
the Consolidated Statements of Income on income from
continuing operations were as follows:
(Millions) 2006 2005 2004
Current income tax provision:
U.S. federal $1,189 $ 864 $ 756
U.S. state and local 156 97 12
Non-U.S. 351 385 165
Total current provision 1,696 1,346 933
Deferred income tax
(benefit) provision:
U.S. federal (68) (236) 308
U.S. state and local (36) (46) 7
Non-U.S. 7(37) (103)
Total deferred (benefit)
provision (97) (319) 212
Total income tax
provision $1,599 $ 1,027 $1,145
A reconciliation of the U.S. federal statutory rate of 35
percent to the Company’s effective income tax rate for
2006, 2005, and 2004 on continuing operations was
as follows:
2006 2005 2004
Combined tax at U.S. statutory rate 35.0% 35.0% 35.0%
Changes in taxes resulting from:
Tax-preferred investments (3.0) (3.7) (4.2)
State and local income taxes 1.5 0.8 0.3
Non-U.S. subsidiaries earnings (3.6) (3.4) (2.4)
IRS tax settlements (0.3) (4.5) (0.5)
All other 0.4 — 1.6
Effective tax rates 30.0% 24.2% 29.8%
Accumulated earnings of certain non-U.S. subsidiaries,
which totaled approximately $3.9 billion at December
31, 2006, are intended to be permanently reinvested
outside the United States. Accordingly, federal taxes,
which would have aggregated approximately $856
million, have not been provided on those earnings.
The Company records a deferred income tax (benefit)
provision when there are differences between assets
and liabilities measured for financial reporting and for
income tax return purposes. The significant components
of deferred tax assets and liabilities at December 31 are
reflected in the following table:
(Millions) 2006 2005
Deferred tax assets:
Reserves not yet deducted for tax
purposes $2,868 $2,583
Employee compensation and benefits 602 274
Other 103 105
Gross deferred tax assets 3,573 2,962
Valuation a llowance (51) (55)
Total deferred tax assets 3,522 2,907
Deferred tax liabilities:
Depreciation and amortization 582 533
Deferred revenue 380 345
Asset securitizations 323 310
Deferred foreign tax credits 209 61
Other 388 388
Gross deferred tax liabilities 1,882 1,637
Net deferred tax assets $1,640 $1,270
The valuation allowances at December 31, 2006 and
2005 relate to deferred tax assets associated with non-
U.S. operations.
Income taxes paid by the Company (including
amounts related to discontinued operations) during
2006, 2005, and 2004 were approximately $1.4 billion,
$1.7 billion, and $1.1 billion, respectively. These amounts
include estimated tax payments and cash settlements
relating to prior tax years.
The tax benefit realized for tax deductions from
stock option exercises which are recorded in additional
paid-in capital totaled $128 million, $234 million, and
$158 million for the years ended December 31, 2006,
2005, and 2004, respectively.
Comprehensive income in the Consolidated
Statements of Shareholders’ Equity is presented net of
the following income tax (benefit) provision amounts:
COMPREHENSIVE INCOME COMPONENTS
(Millions) 2006 2005 2004
Net unrealized securities losses $(27)$(103) $ (92)
Net unrealized derivative (losses) gains (61) 139 152
Foreign currency translation gains 12 29 11
Minimum pension liability 10 (2) —
Net unrealized pension and other
postretirement benefit costs (210) ——
Income tax (benefit) provision $(276) $63$71