Apple 1995 Annual Report Download - page 12
Download and view the complete annual report
Please find page 12 of the 1995 Apple annual report below. You can navigate through the pages in the report by either clicking on the pages listed below, or by using the keyword search tool below to find specific information within the annual report.-
 1
1 -
 2
2 -
 3
3 -
 4
4 -
 5
5 -
 6
6 -
 7
7 -
 8
8 -
 9
9 -
 10
10 -
 11
11 -
 12
12 -
 13
13 -
 14
14 -
 15
15 -
 16
16 -
 17
17 -
 18
18 -
 19
19 -
 20
20 -
 21
21 -
 22
22 -
23
-
24
-
25
-
26
-
27
-
28
-
29
-
30
-
31
-
32
-
33
-
34
-
35
-
36
-
37
-
38
-
39
-
40
-
41
-
42
-
43
-
44
-
45
-
46
-
47
-
48
-
49
-
50
-
51
-
52
-
53
-
54
-
55
-
56
-
57
-
58
-
59
-
60
-
61
-
62
 |
 |
Item 7. Management's Discussion and Analysis of Financial Condition and Results of Operations
The following discussion should be read in conjunction with the consolidated financial statements and notes thereto. All information is based
on the Company's fiscal calendar.
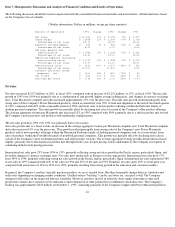
(Tabular information: Dollars in millions, except per share amounts)
Net Sales
Net sales increased $1,873 million, or 20%, in fiscal 1995, compared with an increase of $1,212 million, or 15%, in fiscal 1994. The net sales
growth in 1995 over 1994 was primarily due to a combination of unit growth, higher average selling prices, and changes in currency exchange
rates. Total Macintosh computer unit sales increased approximately 15% over the prior year. This unit sales growth resulted principally from
strong sales of the Company's Power Macintosh products, which accounted for over 70% of total unit shipments at the end of the fourth quarter
of 1995, compared with 26% in the comparable period of 1994, and from sales of newer product offerings within the Performa family of
desktop personal computers. This unit growth was partially offset by declining unit sales of certain of the Company's older product offerings.
The average aggregate revenue per Macintosh unit increased 12% in 1995 compared with 1994, primarily due to a shift in product mix toward
the Company's newer products and products with multimedia configurations.
The net sales growth in 1994 over 1993 was primarily due to two factors:
unit sales growth and, to a lesser extent, an increase in the average aggregate revenue per Macintosh computer unit. Total Macintosh computer
unit sales increased 16% over the prior year. This growth resulted principally from strong sales of the Company's new Power Macintosh
products and of newer product offerings within the Macintosh Performa family of desktop personal computers and, to a lesser extent, from
sales of products within the PowerBook family of notebook personal computers. This growth was partially offset by declining unit sales in
certain of the Company's more established products and older product versions. The average aggregate revenue per Macintosh unit increased
slightly, primarily due to fluctuations in product mix throughout the year, despite pricing actions undertaken by the Company in response to
continuing industrywide pricing pressures.
International net sales grew 25% from 1994 to 1995, primarily reflecting strong net sales growth in the Pacific region, particularly Japan, and
favorable changes in currency exchange rates. Net sales grew moderately in Europe over the same period. International net sales grew 17%
from 1993 to 1994, primarily reflecting strong net sales growth in the Pacific region, particularly Japan. International net sales represented 48%
of net sales in 1995 compared with 46% of net sales in 1994 and 45% of net sales in 1993. Domestic net sales grew 16% over the prior year,
compared with an increase of 14% in 1994 over 1993, primarily resulting from strong growth in the education and consumer markets.
In general, the Company's resellers typically purchase products on an as- needed basis. Resellers frequently change delivery schedules and
order rates depending on changing market conditions. Unfilled orders ("backlog") can be, and often are, canceled at will. The Company
attempts to fill orders on the requested delivery schedules. However, products may be in relatively short supply from time to time until
production volumes have reached a level sufficient to meet demand or if other production or fulfillment constraints exist. The Company's
backlog was approximately $618 million at December 1, 1995, consisting primarily of the Company's higher-end Power Macintosh products.
10
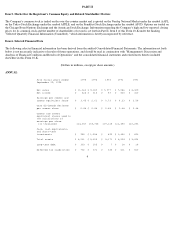
Results of Operations 1995 Change 1994 Change 1993
Net sales $ 11,062 20% $ 9,189 15% $ 7,977
Gross margin $ 2,858 22% $ 2,343 -14% $ 2,728
Percentage of net sales 25.8% 25.5% 34.2%
Research and development $ 614 9% $ 564 -15% $ 665
Percentage of net sales 5.6% 6.1% 8.3%
Selling, general and
administrative $ 1,583 14% $ 1,384 -15% $ 1,632
Percentage of net sales 14.3% 15.1% 20.5%
Operating expenses (excluding
restructuring costs) $ 2,197 13% $ 1,948 -15% $ 2,297
Percentage of net sales 19.9% 21.2% 28.8%
Restructuring costs $ (23) -82% $ (127) -140% $ 321
Percentage of net sales (0.2%) (1.4%) 4.0%
Interest and other income
(expense), net $ (10) 55% $ (22) -175% $ 30
Net income $ 424 37% $ 310 258% $ 87
Earnings per share $ 3.45 32% $ 2.61 258% $ 0.73