Apple 1995 Annual Report Download - page 49
Download and view the complete annual report
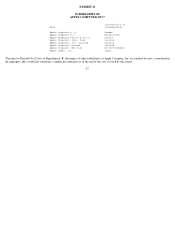
Please find page 49 of the 1995 Apple annual report below. You can navigate through the pages in the report by either clicking on the pages listed below, or by using the keyword search tool below to find specific information within the annual report.-
 1
1 -
2
-
3
-
4
-
5
-
6
-
7
-
8
-
9
-
10
-
11
-
12
-
13
-
14
-
15
-
16
-
17
-
18
-
19
-
20
-
21
-
22
-
23
-
24
-
25
-
26
-
27
-
28
-
29
-
30
-
31
-
32
-
33
-
34
-
35
-
36
-
37
-
38
-
 39
39 -
 40
40 -
 41
41 -
 42
42 -
 43
43 -
 44
44 -
 45
45 -
 46
46 -
 47
47 -
 48
48 -
 49
49 -
 50
50 -
 51
51 -
 52
52 -
 53
53 -
 54
54 -
 55
55 -
 56
56 -
 57
57 -
 58
58 -
 59
59 -
60
-
61
-
62
 |
 |
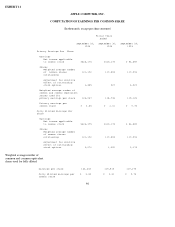
EXHIBIT 11
APPLE COMPUTER, INC.
COMPUTATION OF EARNINGS PER COMMON SHARE
(In thousands, except per share amounts)
Weighted average number of
common and common equivalent
shares used for fully diluted
46
Fiscal Years
Ended
September 29, September 30, September 24,
1995 1994 1993
Primary Earnings Per Share
Earnings
Net income applicable
to common stock $424,175 $310,178 $ 86,589
Shares
Weighted average number
of common shares 121,192 117,808 117,096
outstanding
Adjustment for dilutive
effect of outstanding
stock options 1,855 927 2,029
Weighted average number of
common and common equivalent
shares used for
primary earnings per share 123,047 118,735 119,125
Primary earnings per
common share $ 3.45 $ 2.61 $ 0.73
Fully Diluted Earnings Per
Share
Earnings
Net income applicable
to common stock $424,175 $310,178 $ 86,589
Shares
Weighted average number
of common shares
outstanding 121,192 117,808 117,096
Adjustment for dilutive
effect of outstanding
stock options 2,076 1,002 2,174
earnings per share 123,268 118,810 119,270
Fully diluted earnings per $ 3.44 $ 2.61 $ 0.73
common share