Apple 1995 Annual Report Download - page 37
Download and view the complete annual report
Please find page 37 of the 1995 Apple annual report below. You can navigate through the pages in the report by either clicking on the pages listed below, or by using the keyword search tool below to find specific information within the annual report.-
 1
1 -
2
-
3
-
4
-
5
-
6
-
7
-
8
-
9
-
10
-
11
-
12
-
13
-
14
-
15
-
16
-
17
-
18
-
19
-
20
-
21
-
22
-
23
-
24
-
25
-
26
-
 27
27 -
 28
28 -
 29
29 -
 30
30 -
 31
31 -
 32
32 -
 33
33 -
 34
34 -
 35
35 -
 36
36 -
 37
37 -
 38
38 -
 39
39 -
 40
40 -
 41
41 -
 42
42 -
 43
43 -
 44
44 -
 45
45 -
 46
46 -
 47
47 -
48
-
49
-
50
-
51
-
52
-
53
-
54
-
55
-
56
-
57
-
58
-
59
-
60
-
61
-
62
 |
 |
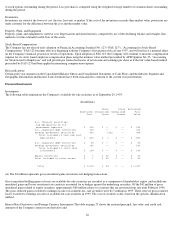
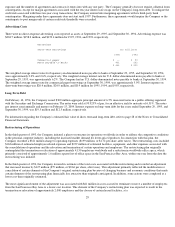
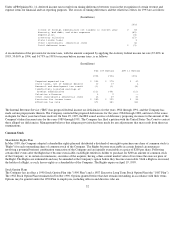
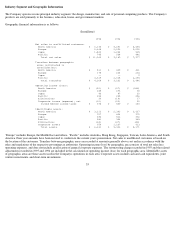
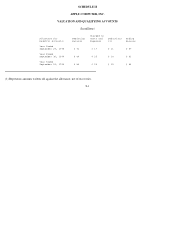
Industry Segment and Geographic Information
The Company operates in one principal industry segment: the design, manufacture, and sale of personal computing products. The Company's
products are sold primarily to the business, education, home, and government markets.
Geographic financial information is as follows:
(In millions)
"Europe" includes Europe, the Middle East and Africa. "Pacific" includes Australia, Hong Kong, Singapore, Taiwan, Latin America, and South
America. Prior year amounts have been restated to conform to the current year's presentation. Net sales to unaffiliated customers is based on
the location of the customers. Transfers between geographic areas are recorded at amounts generally above cost and in accordance with the
rules and regulations of the respective governing tax authorities. Operating income (loss) by geographic area consists of total net sales less
operating expenses, and does not include an allocation of general corporate expenses. The restructuring charge recorded in 1993 and the related
adjustments recorded in 1995 and 1994 are included in the calculation of operating income (loss) for each geographic area. Identifiable assets
of geographic areas are those assets used in the Company's operations in each area. Corporate assets include cash and cash equivalents, joint
venture investments, and short-term investments.
35
1995 1994 1993
Net sales to unaffiliated customers:
North America $ 6,130 $ 5,291 $ 4,694
Europe 2,365 2,096 2,002
Japan 1,822 1,234 835
Pacific 745 568 446
Total net sales $ 11,062 $ 9,189 $ 7,977
Transfers between geographic
areas (eliminated in
consolidation):
North America $ 511 $ 409 $ 421
Europe 178 234 263
Japan -- -- 9
Pacific 3,619 2,618 2,293
Total transfers $ 4,308 $ 3,261 $ 2,986
Operating income (loss):
North America $ (20) $ (27) $ (243)
Europe 245 276 60
Japan 46 47 20
Pacific 383 245 256
Eliminations 30 (19) 17
Corporate income (expense), net (10) (22) 30
Income before income taxes $ 674 $ 500 $ 140
Identifiable assets:
North America $ 3,112 $ 2,393 $ 2,627
Europe 927 824 970
Japan 686 522 362
Pacific 581 364 345
Eliminations (34) (67) (46)
Corporate assets 959 1,267 913
Total assets $ 6,231 $ 5,303 $ 5,171