Apple 1995 Annual Report Download - page 28
Download and view the complete annual report
Please find page 28 of the 1995 Apple annual report below. You can navigate through the pages in the report by either clicking on the pages listed below, or by using the keyword search tool below to find specific information within the annual report.-
 1
1 -
2
-
3
-
4
-
5
-
6
-
7
-
8
-
9
-
10
-
11
-
12
-
13
-
14
-
15
-
16
-
17
-
 18
18 -
 19
19 -
 20
20 -
 21
21 -
 22
22 -
 23
23 -
 24
24 -
 25
25 -
 26
26 -
 27
27 -
 28
28 -
 29
29 -
 30
30 -
 31
31 -
 32
32 -
 33
33 -
 34
34 -
 35
35 -
 36
36 -
 37
37 -
 38
38 -
39
-
40
-
41
-
42
-
43
-
44
-
45
-
46
-
47
-
48
-
49
-
50
-
51
-
52
-
53
-
54
-
55
-
56
-
57
-
58
-
59
-
60
-
61
-
62
 |
 |
to stock options outstanding during the period. Loss per share is computed using the weighted average number of common shares outstanding
during the period.
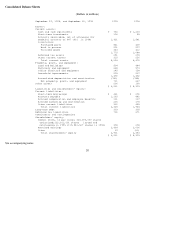
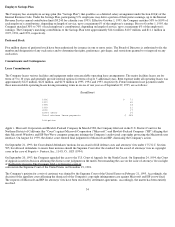
Inventories
Inventories are stated at the lower of cost (first-in, first-out) or market. If the cost of the inventories exceeds their market value, provisions are
made currently for the difference between the cost and the market value.
Property, Plant, and Equipment
Property, plant, and equipment is stated at cost. Depreciation and amortization is computed by use of the declining balance and straight- line
methods over the estimated useful lives of the assets.
Stock-Based Compensation
The Company has not elected early adoption of Financial Accounting Standard No. 123 ("FAS 123"), "Accounting for Stock-Based
Compensation." FAS 123 becomes effective beginning with the Company's first quarter of fiscal year 1997, and will not have a material effect
on the Company's financial position or results of operations. Upon adoption of FAS 123, the Company will continue to measure compensation
expense for its stock- based employee compensation plans using the intrinsic value method prescribed by APB Opinion No. 25, "Accounting
for Stock Issued to Employees" and will provide pro forma disclosures of net income and earnings per share as if the fair value-based method
prescribed by FAS 123 had been applied in measuring compensation expense.
Reclassifications
Certain prior year amounts on the Consolidated Balance Sheets and Consolidated Statements of Cash Flows and the Industry Segment and
Geographic Information and Income Taxes footnotes have been reclassified to conform to the current year presentation.
Financial Instruments
Investments
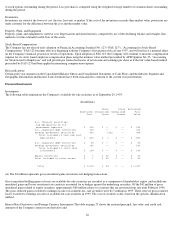
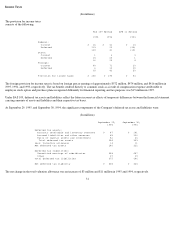
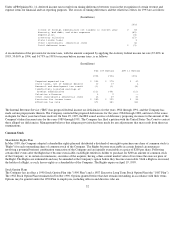
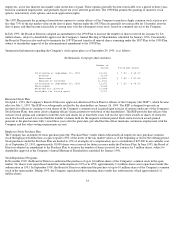
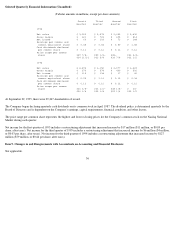
The following table summarizes the Company's available-for-sale securities as of September 29, 1995:
(In millions)
(A) The $2 million represents gross unrealized gains on interest rate hedging transactions.
Gross unrealized holding gains or losses on available-for-sale securities are recorded as a component of shareholders' equity, and include any
unrealized gains and losses on interest rate contracts accounted for as hedges against the underlying securities. Of the $42 million of gross
unrealized gains related to equity securities, approximately $40 million relates to securities that are restricted from sale until February 1996.
The gross realized gains recorded to earnings on sales of available-for- sale securities were $1.5 million in 1995. There were no gross realized
losses recorded to earnings on sales of available-for-sale securities in 1995. The cost of securities sold is based on the specific identification
method.
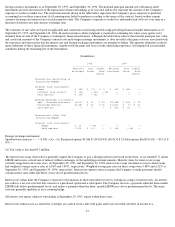
Interest Rate Derivatives and Foreign Currency Instruments The table on page 27 shows the notional principal, fair value, and credit risk
amounts of the Company's interest rate derivative and
26
Gross Gross Estimated
Amortized Unrealized Unrealized Fair
Cost Gains Losses Value
U.S. Treasury securities
and obligations of U.S.
government agencies $ 232 $ -- $ -- $ 232
U.S. corporate debt securities 140 -- -- 140
Foreign government securities 456 2(A) -- 458
Total included in cash and cash
equivalents $ 828 $ 2 $ -- $ 830
U.S. corporate debt securities $ 48 $ -- $ -- $ 48
Foreign government securities 146 -- -- 146
Total included in short-term
investments $ 194 $ -- $ -- $ 194
Equity securities $ 1 $ 42 $ -- $ 43
Total included in other assets $ 1 $ 42 $ -- $ 43
Total $ 1,023 $ 44 $ -- $ 1,067