Apple 1995 Annual Report Download - page 53
Download and view the complete annual report
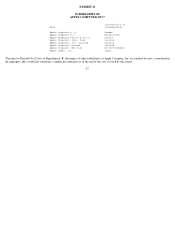
Please find page 53 of the 1995 Apple annual report below. You can navigate through the pages in the report by either clicking on the pages listed below, or by using the keyword search tool below to find specific information within the annual report.-
 1
1 -
2
-
3
-
4
-
5
-
6
-
7
-
8
-
9
-
10
-
11
-
12
-
13
-
14
-
15
-
16
-
17
-
18
-
19
-
20
-
21
-
22
-
23
-
24
-
25
-
26
-
27
-
28
-
29
-
30
-
31
-
32
-
33
-
34
-
35
-
36
-
37
-
38
-
39
-
40
-
41
-
42
-
 43
43 -
 44
44 -
 45
45 -
 46
46 -
 47
47 -
 48
48 -
 49
49 -
 50
50 -
 51
51 -
 52
52 -
 53
53 -
 54
54 -
 55
55 -
 56
56 -
 57
57 -
 58
58 -
 59
59 -
 60
60 -
 61
61 -
 62
62
 |
 |
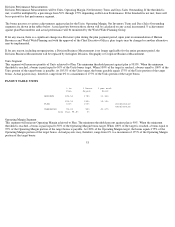
Individual Performance Measurement
The Individual Performance Measurement is based on performance against two to four objectives that are aligned with Corporate/Division
strategic objectives.
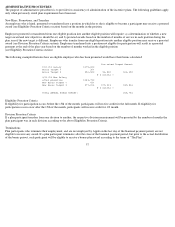
Weighting of Performance Measurements
The weighting is from 60% to 80% on financial performance measurements and 20% to 40% on individual performance measurements,
depending on position as shown in the table below. The financial results used in determining financial performance are based on the
participant's position and will be either a Corporate or Divisional measurement. Functional Staff (e.g. Finance, Human Resources, Information
Systems and Legal.) within a Division will be measured on the Division's Business Measurements. Details of the weighting of financial and
individual performance measurements are as follows:
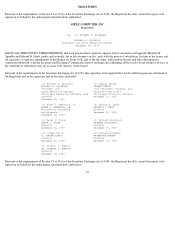
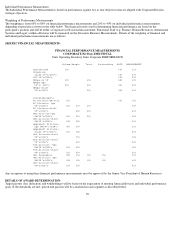
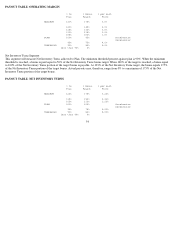
SR/EXEC FINANCIAL MEASUREMENTS:
FINANCIAL PERFORMANCE MEASUREMENTS
CORPORATE Net Days INDIVIDUAL
Units Operating Inventory Sales Corporate PERFORMANCE
Any exceptions to using these financial performance measurements must be approved by the Senior Vice President of Human Resources.
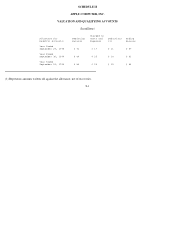
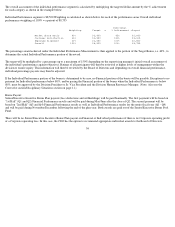
DETAILS OF AWARD DETERMINATION:
Target payouts (less deductions and withholdings) will be based on the expectation of meeting financial/division and individual performance
goals. If the thresholds are met, period-end payouts will be calculated in each segment as described below.
50
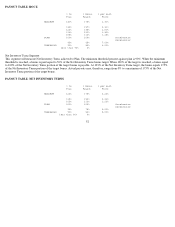
Volume Margin Turns Outstanding ROCE MEASUREMENT
CEO/CFO/OOP 20% 60% 20%
Corporate
Staff VP's/DIR's 60% 40%
ATG VP's/DIR's 60% 40%
WWOps-Sr VP 20% 25% 35% 20%
WWOps-Ops
VP's/ DIR's 20% 20% 30% 30%
WWOps-Staff
VP's/DIR's 30% 30% 40%
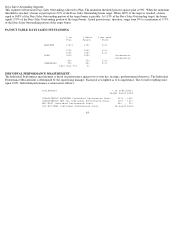
DIVISIONS/GEO's
PC Division-GM only 20% 60% 20%
PC Division- Ops
VP's/DIR's 20% 30% 20% 30%
PC Division-Staff
VP's/DIR's 40% 20% 40%
ABS Division-Ops
GM/VP's/DIR's 20% 30% 20% 30%
ABS Division-Staff
GM/VP's/DIR's 25% 35% 40%
AppleSoft Division-
Ops GM/VP's/DIR's 40% 30% 30%
AppleSoft Division-
Staff VP's/DIR's 25% 35% 40%
AOS Division-Staff
VP's/DIR's 70% 30%
AOS Division-Staff
VP's/DIR's 60% 40%
PIE Division -Ops
GM/VP's/DIR's 20% 50% 30%
PIE Division-Staff
VP's/DIR's 20% 40% 40%
GEO Presidents 35% 15% 15% 15% 20%
GEO Division- Ops
GM/VP's/DIR's 25% 15% 15% 15% 30%
GEO Division-Staff
VP's/DIR's 25% 35% 40%