Apple 1995 Annual Report Download - page 25
Download and view the complete annual report
Please find page 25 of the 1995 Apple annual report below. You can navigate through the pages in the report by either clicking on the pages listed below, or by using the keyword search tool below to find specific information within the annual report.-
 1
1 -
2
-
3
-
4
-
5
-
6
-
7
-
8
-
9
-
10
-
11
-
12
-
13
-
14
-
 15
15 -
 16
16 -
 17
17 -
 18
18 -
 19
19 -
 20
20 -
 21
21 -
 22
22 -
 23
23 -
 24
24 -
 25
25 -
 26
26 -
 27
27 -
 28
28 -
 29
29 -
 30
30 -
 31
31 -
 32
32 -
 33
33 -
 34
34 -
 35
35 -
36
-
37
-
38
-
39
-
40
-
41
-
42
-
43
-
44
-
45
-
46
-
47
-
48
-
49
-
50
-
51
-
52
-
53
-
54
-
55
-
56
-
57
-
58
-
59
-
60
-
61
-
62
 |
 |
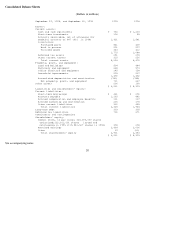
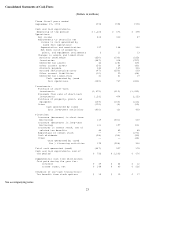
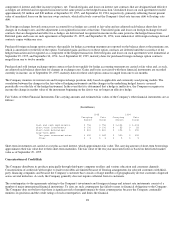
Consolidated Statements of Cash Flows
(Dollars in millions)
See accompanying notes.
23
Three fiscal years ended
September 29, 1995 1995 1994 1993
Cash and cash equivalents,
beginning of the period $ 1,203 $ 676 $ 498
Operations:
Net income 424 310 87
Adjustments to reconcile net
income to cash generated by
(used for) operations:
Depreciation and amortization 127 168 166
Net book value of property,
plant, and equipment retirements 6 11 13
Changes in assets and liabilities:
Accounts receivable (350) (199) (295)
Inventories (687) 418 (927)
Deferred tax assets 42 (25) (69)
Other current assets (59) 34 (96)
Accounts payable 283 139 316
Accrued restructuring costs (47) (250) 203
Other current liabilities (10) 90 (68)
Deferred tax liabilities 31 41 19
Cash generated by (used
for) operations (240) 737 (651)
Investments:
Purchase of short-term
investments (1,672) (312) (1,432)
Proceeds from sale of short-term
investments 1,531 474 2,153
Purchase of property, plant, and
equipment (159) (160) (213)
Other (102) (4) (15)
Cash generated by (used
for) investment activities (402) (2) 493
Financing:
Increase (decrease) in short-term
borrowings 169 (531) 639
Increase (decrease) in long-term
borrowings (2) 297 (11)
Increases in common stock, net of
related tax benefits 86 82 85
Repurchase of common stock -- -- (273)
Cash dividends (58) (56) (56)
Other -- -- (48)
Cash generated by (used
for ) financing activities 195 (208) 336
Total cash generated (used) (447) 527 178
Cash and cash equivalents, end of
the period $ 756 $ 1,203 $ 676
Supplemental cash flow disclosures:
Cash paid during the year for:
Interest $ 49 $ 34 $ 12
Income taxes, net $ 188 $ 46 $ 226
Schedule of non-cash transactions:
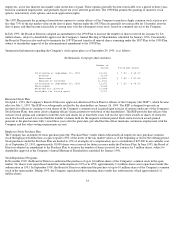
Tax benefit from stock options $ 15 $ 12 $ 17