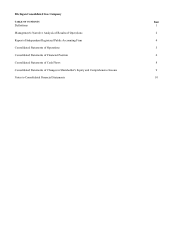
DTE Energy 2011 Annual Report Download - page 10
Download and view the complete annual report
Please find page 10 of the 2011 DTE Energy annual report below. You can navigate through the pages in the report by either clicking on the pages listed below, or by using the keyword search tool below to find specific information within the annual report.-
 1
1 -
 2
2 -
 3
3 -
 4
4 -
 5
5 -
 6
6 -
 7
7 -
 8
8 -
 9
9 -
 10
10 -
 11
11 -
 12
12 -
 13
13 -
 14
14 -
 15
15 -
 16
16 -
 17
17 -
 18
18 -
 19
19 -
 20
20 -
 21
21 -
22
-
23
-
24
-
25
-
26
-
27
-
28
-
29
-
30
-
31
-
32
-
33
-
34
-
35
-
36
-
37
-
38
 |
 |

8
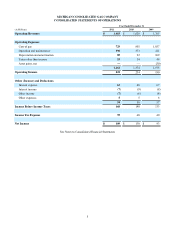
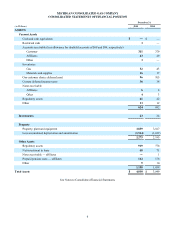
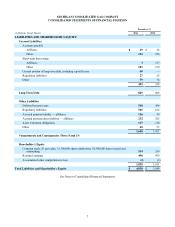
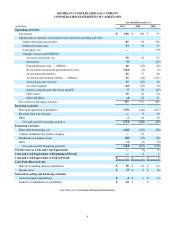
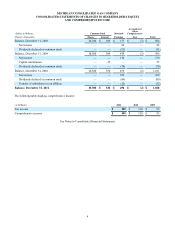
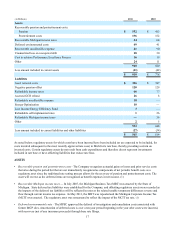
MICHIGAN CONSOLIDATED GAS COMPANY
CONSOLIDATED STATEMENTS OF CASH FLOWS
(in Millions)
Operating Activities
Net income
Adjustments to reconcile net income to net cash from operating activities:
Depreciation and amortization
Deferred income taxes
Asset gains, net
Changes in assets and liabilities:
Accounts receivable, net
Inventories
Prepaid pension costs — affiliates
Recoverable pension and postretirement costs
Accrued pension liability
Accrued postretirement liability — affiliates
Accrued gas cost recovery
Accounts payable
Income, property and other taxes payable
Other assets
Other liabilities
Net cash from operating activities
Investing Activities
Plant and equipment expenditures
Proceeds from sale of assets
Other
Net cash used for investing activities
Financing Activities
Short-term borrowings, net
Capital contribution by parent company
Dividends on common stock
Other
Net cash used for financing activities
Net Decrease in Cash and Cash Equivalents
Cash and Cash Equivalents at Beginning of Period
Cash and Cash Equivalents at End of Period
Cash Paid (Received) for:
Interest (excluding interest capitalized)
Income taxes
Noncash investing and financing activities
Accrued capital expenditures
Transfer of subsidiaries to an affiliate
Year Ended December 31
2011
$ 109
89
53
—
59
(9)
66
(184)
85
51
17
(19)
5
39
(4)
357
(175)
—
2
(173)
(102)
—
(80)
(2)
(184)
—
—
$ —
$ 56
$(5)
$ 4
$ 12
2010
$ 130
92
70
—
25
—
(23)
(6)
17
(36)
(16)
(25)
35
26
22
311
(146)
9
29
(108)
(156)
25
(70)
(4)
(205)
(2)
2
$ —
$ 67
$ 9
$ 3
$ —
2009
$ 93
109
57
(30)
87
(27)
(18)
(6)
20
(131)
26
(9)
(47)
60
21
205
(167)
70
29
(68)
(80)
—
(50)
(8)
(138)
(1)
3
$ 2
$ 66
$(8)
$(5)
$ —
See Notes to Consolidated Financial Statements