DTE Energy 2011 Annual Report Download - page 22
Download and view the complete annual report
Please find page 22 of the 2011 DTE Energy annual report below. You can navigate through the pages in the report by either clicking on the pages listed below, or by using the keyword search tool below to find specific information within the annual report.-
 1
1 -
2
-
3
-
4
-
5
-
6
-
7
-
8
-
9
-
10
-
11
-
 12
12 -
 13
13 -
 14
14 -
 15
15 -
 16
16 -
 17
17 -
 18
18 -
 19
19 -
 20
20 -
 21
21 -
 22
22 -
 23
23 -
 24
24 -
 25
25 -
 26
26 -
 27
27 -
 28
28 -
 29
29 -
 30
30 -
 31
31 -
 32
32 -
33
-
34
-
35
-
36
-
37
-
38
 |
 |

20
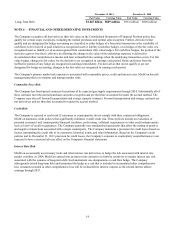
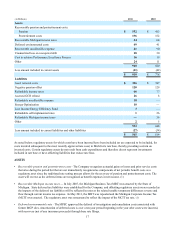
outside locations and renew service lines. In a September 30, 2010 filing, MichCon proposed to implement a 10-year gas meter
move out program beginning in 2012 which would require capital expenditures of approximately $22 million per year primarily
for relocation of inside meters to the outside of residents' houses. In September 2011, the MPSC issued orders approving both
programs and requested MichCon to include the recovery of costs associated with these two programs in future MichCon rate
cases.
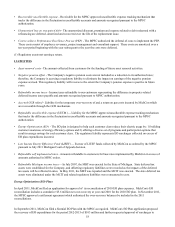
Other
The Company is unable to predict the outcome of the unresolved regulatory matters discussed herein. Resolution of these
matters is dependent upon future MPSC orders and appeals, which may materially impact the financial position, results of
operations and cash flows of the Company.
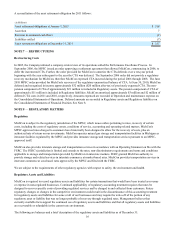
NOTE 9 — INCOME TAXES
Income Tax Summary
MichCon is part of the consolidated federal income tax return of DTE Energy. Our federal income tax expense is determined on
an individual company basis with no allocation of tax benefits or expenses from other affiliates of DTE Energy. MichCon had
an income tax receivable of $42 million at December 31, 2011 and $48 million at December 31, 2010 due from DTE Energy.
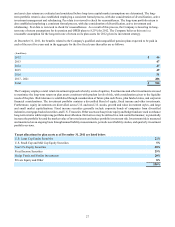
Total income tax expense varied from the statutory federal income tax rate for the following reasons:
(Dollars in Millions)
Income tax expense at 35% statutory rate
Depreciation
State and local income taxes, net of federal benefit
Other, net
Total
Effective income tax rate
2011
$ 59
(7)
9
(2)
$ 59
35.1%
2010
$ 69
(7)
9
(3)
$ 68
34.3%
2009
$ 46
(7)
3
(2)
$ 40
30.0%
Components of income tax expense (benefit) were as follows:
(in Millions)
Current income taxes
Federal
State and other income tax expense
Total current income taxes
Deferred federal and other income tax expense
Federal
State and other income tax expense
Total deferred income taxes
Total
2011
$ —
6
6
46
7
53
$ 59
2010
$(5)
3
(2)
60
10
70
$ 68
2009
$(21)
4
(17)
56
1
57
$ 40
Deferred tax assets and liabilities are recognized for the estimated future tax effect of temporary differences between the tax
basis of assets or liabilities and the reported amounts in the financial statements. Deferred tax assets and liabilities are classified
as current or noncurrent according to the classification of the related assets or liabilities. Deferred tax assets and liabilities not
related to assets or liabilities are classified according to the expected reversal date of the temporary differences. Consistent with
rate making treatment, deferred taxes are offset in the table below for temporary differences which have related regulatory
assets and liabilities.
Deferred income tax assets (liabilities) were comprised of the following at December 31: