DTE Energy 2011 Annual Report Download - page 33
Download and view the complete annual report
Please find page 33 of the 2011 DTE Energy annual report below. You can navigate through the pages in the report by either clicking on the pages listed below, or by using the keyword search tool below to find specific information within the annual report.-
 1
1 -
2
-
3
-
4
-
5
-
6
-
7
-
8
-
9
-
10
-
11
-
12
-
13
-
14
-
15
-
16
-
17
-
18
-
19
-
20
-
21
-
22
-
 23
23 -
 24
24 -
 25
25 -
 26
26 -
 27
27 -
 28
28 -
 29
29 -
 30
30 -
 31
31 -
 32
32 -
 33
33 -
 34
34 -
 35
35 -
 36
36 -
 37
37 -
 38
38
 |
 |

31
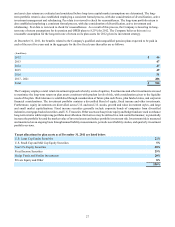
The following table reconciles the obligations, assets and funded status of the Company's portion of the plans including
amounts recorded as accrued postretirement cost in the Consolidated Statements of Financial Position at December 31:
(in Millions)
Change in accumulated postretirement benefit obligation
Accumulated postretirement benefit obligation, beginning of year
Service cost
Interest cost
Plan amendments
Actuarial loss
Medicare Part D subsidy
Benefits paid
Accumulated postretirement benefit obligation, end of year
2011
$ 528
15
27
(1)
19
2
(26)
$ 564
2010
$ 488
14
28
(16)
39
2
(27)
$ 528
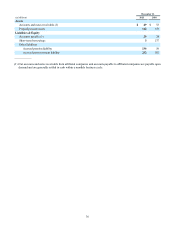
(in Millions)
Change in plan assets
Plan assets at fair value, beginning of year
Company contributions
Actual return on plan assets
Benefits paid
Plan assets at fair value, end of year
Funded status at fair value, December 31
Noncurrent liabilities
Amounts recognized in Regulatory assets
Net loss
Prior service credit
Net transition obligation
Regulatory Asset — postretirement costs
2011
$ 346
45
(6)
(53)
$ 332
$(232)
$(232)
$ 202
(7)
1
$ 196
2010
$ 270
70
32
(26)
$ 346
$(182)
$(182)
$ 158
(8)
2
$ 152
Assumptions used in determining the projected benefit obligation and net benefit cost are listed below:
Projected benefit obligation
Discount rate
Net benefit costs
Discount rate
Expected long-term rate of return on plan assets
Health care trend rate pre- and post-65
Ultimate health care trend rate
Year in which ultimate reached
2011
5.00%
5.50%
8.75%
7.00%
5.00%
2019
2010
5.50%
5.90%
8.75%
7.00%
5.00%
2016
2009
5.90%
6.90%
8.75%
7.00%
5.00%
2016
A one percentage point increase in health care cost trend rates would have increased the total service cost and interest cost
components of benefit costs by $7 million and increased the accumulated benefit obligation by $55 million at December 31,
2011. A one percentage point decrease in the health care cost trend rates would have decreased the total service cost and interest
cost components of benefit costs by $6 million and would have decreased the accumulated benefit obligation by $85 million at
December 31, 2011.