DTE Energy 2011 Annual Report Download - page 31
Download and view the complete annual report
Please find page 31 of the 2011 DTE Energy annual report below. You can navigate through the pages in the report by either clicking on the pages listed below, or by using the keyword search tool below to find specific information within the annual report.-
 1
1 -
2
-
3
-
4
-
5
-
6
-
7
-
8
-
9
-
10
-
11
-
12
-
13
-
14
-
15
-
16
-
17
-
18
-
19
-
20
-
 21
21 -
 22
22 -
 23
23 -
 24
24 -
 25
25 -
 26
26 -
 27
27 -
 28
28 -
 29
29 -
 30
30 -
 31
31 -
 32
32 -
 33
33 -
 34
34 -
 35
35 -
 36
36 -
 37
37 -
 38
38
 |
 |

29
pricing services. Non-exchange traded securities and exchange-traded securities held in commingled funds are classified as
Level 2 assets.
(g) This category utilizes a diversified group of strategies that attempt to capture financial market inefficiencies and includes
publicly traded debt and equity, publicly traded mutual funds, commingled and limited partnership funds and non-exchange
traded securities. Pricing for Level 1 and Level 2 assets in this category is obtained from quoted prices in actively traded
markets and quoted prices from broker or pricing services. Non-exchanged traded securities held in commingled funds are
classified as Level 2 assets. Valuations for some Level 3 assets in this category may be based on limited observable inputs
as there may be little, if any, publicly available pricing.
(h) This category includes a diversified group of funds and strategies that primarily invests in private equity partnerships. This
category also includes investments in timber and private mezzanine debt. Pricing for investments in this category is based
on limited observable inputs as there is little, if any, publicly available pricing. Valuations for assets in this category may be
based on discounted cash flow analyses, relative publicly-traded comparables and comparable transactions.
The pension trust holds debt and equity securities directly and indirectly through commingled funds and institutional mutual funds.
Exchange-traded debt and equity securities held directly are valued using quoted market prices in actively traded markets. The
commingled funds and institutional mutual funds which hold exchange-traded equity or debt securities are valued based on
underlying securities, using quoted prices in actively traded markets. Non-exchange traded fixed income securities are valued by
the trustee based upon quotations available from brokers or pricing services. A primary price source is identified by asset type,
class or issue for each security. The trustees monitor prices supplied by pricing services and may use a supplemental price source
or change the primary price source of a given security if the trustees challenge an assigned price and determine that another price
source is considered to be preferable. The Company has obtained an understanding of how these prices are derived, including the
nature and observability of the inputs used in deriving such prices. Additionally, the Company selectively corroborates the fair
values of securities by comparison of market-based price sources.
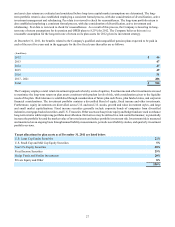
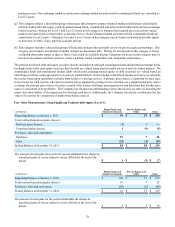
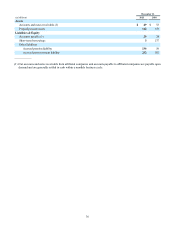
Fair Value Measurements Using Significant Unobservable Inputs (Level 3):
(in Millions)
Beginning Balance at January 1, 2011
Total realized/unrealized gains (losses):
Realized gains (losses)
Unrealized gains (losses)
Purchases, sales and settlements:
Purchases
Sales
Ending Balance at December 31, 2011
The amount of total gains (losses) for the period attributable the change in
unrealized gains or losses related to assets still held at the end of the
period
Hedge Funds and
Similar Investments
$ 95
(1)
1
19
(25)
$ 89
$ 1
Private Equity and
Other
$ 55
1
(9)
7
(4)
$ 50
$(8)
Total
$ 150
—
(8)
26
(29)
$ 139
$(7)
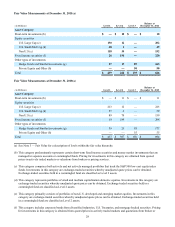
(in Millions)
Beginning Balance at January 1, 2010
Total realized/unrealized gains (losses)
Purchases, sales and settlements
Ending Balance at December 31, 2010
The amount of total gains for the period attributable the change in
unrealized gains or losses related to assets still held at the end of the
period
Hedge Funds and
Similar Investments
$ 160
16
(81)
$ 95
$ 9
Private Equity and
Other
$ 53
7
(5)
$ 55
$ 5
Total
$ 213
23
(86)
$ 150
$ 14