DTE Energy 2011 Annual Report Download - page 28
Download and view the complete annual report
Please find page 28 of the 2011 DTE Energy annual report below. You can navigate through the pages in the report by either clicking on the pages listed below, or by using the keyword search tool below to find specific information within the annual report.-
 1
1 -
2
-
3
-
4
-
5
-
6
-
7
-
8
-
9
-
10
-
11
-
12
-
13
-
14
-
15
-
16
-
17
-
 18
18 -
 19
19 -
 20
20 -
 21
21 -
 22
22 -
 23
23 -
 24
24 -
 25
25 -
 26
26 -
 27
27 -
 28
28 -
 29
29 -
 30
30 -
 31
31 -
 32
32 -
 33
33 -
 34
34 -
 35
35 -
 36
36 -
 37
37 -
 38
38
 |
 |

26
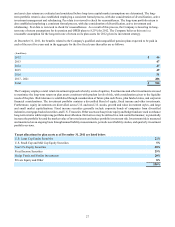
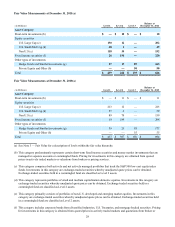
The following table reconciles the obligations, assets and funded status of the Company's portion of the pension plans as well
as the amounts recognized as prepaid pension cost in the Consolidated Statements of Financial Position at December 31:
(in Millions)
Accumulated benefit obligation, end of year
Change in projected benefit obligation
Projected benefit obligation, beginning of year
Service cost
Interest cost
Actuarial loss
Benefits paid
Projected benefit obligation, end of year
Change in plan assets
Plan assets at fair value, beginning of year
Actual return on plan assets
Benefits paid
Plan assets at fair value, end of year
Funded status of the plans, December 31
Amounts recorded as:
Noncurrent assets
Current liabilities
Noncurrent liabilities
(in Millions)
Amounts recognized in Regulatory assets and Accumulated other comprehensive loss
Net actuarial loss
Prior service cost
Regulatory assets
Other comprehensive loss
2011
$ 793
$ 767
14
41
91
(42)
$ 871
$ 894
(7)
(41)
$ 846
$(25)
$ 112
(1)
(136)
$(25)
$ 559
(4)
$ 555
$ 552
3
$ 555
2010
$ 709
$ 722
11
41
35
(42)
$ 767
$ 842
94
(42)
$ 894
$ 127
$ 178
(1)
(50)
$ 127
$ 419
(4)
$ 415
$ 413
2
$ 415
Assumptions used in determining the projected benefit obligation and net pension costs are listed below:
Projected benefit obligation
Discount rate
Rate of compensation increase
Net pension costs
Discount rate
Rate of compensation increase
Expected long-term rate of return on Plan assets
2011
5.00%
4.20%
5.50%
4.00%
8.50%
2010
5.50%
4.00%
5.90%
4.00%
8.75%
2009
5.90%
4.00%
6.90%
4.00%
8.75%
The Company employs a formal process in determining the long-term rate of return for various asset classes. Management
reviews historic financial market risks and returns and long-term historic relationships between the asset classes of equities,
fixed income and other assets, consistent with the widely accepted capital market principle that asset classes with higher
volatility generate a greater return over the long-term. Current market factors such as inflation, interest rates, asset class risks