DTE Energy 2011 Annual Report Download - page 4
Download and view the complete annual report
Please find page 4 of the 2011 DTE Energy annual report below. You can navigate through the pages in the report by either clicking on the pages listed below, or by using the keyword search tool below to find specific information within the annual report.-
 1
1 -
 2
2 -
 3
3 -
 4
4 -
 5
5 -
 6
6 -
 7
7 -
 8
8 -
 9
9 -
 10
10 -
 11
11 -
 12
12 -
 13
13 -
 14
14 -
 15
15 -
16
-
17
-
18
-
19
-
20
-
21
-
22
-
23
-
24
-
25
-
26
-
27
-
28
-
29
-
30
-
31
-
32
-
33
-
34
-
35
-
36
-
37
-
38
 |
 |

2
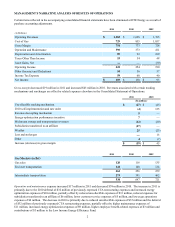
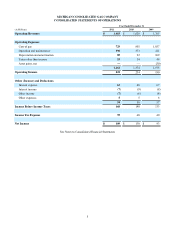
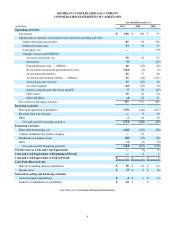
MANAGEMENT'S NARRATIVE ANALYSIS OF RESULTS OF OPERATIONS
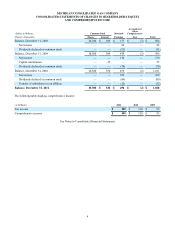
Certain items reflected in the accompanying consolidated financial statements have been eliminated at DTE Energy as a result of
purchase accounting adjustments.
(in Millions)
Operating Revenues
Cost of Gas
Gross Margin
Operation and Maintenance
Depreciation and Amortization
Taxes Other Than Income
Asset Gains, Net
Operating Income
Other (Income) and Deductions
Income Tax Expense
Net Income
2011
$ 1,483
729
754
390
89
53
—
222
54
59
$ 109
2010
$ 1,628
855
773
373
92
54
—
254
56
68
$ 130
2009
$ 1,765
1,037
728
411
109
48
(30)
190
57
40
$ 93
Gross margin decreased $19 million in 2011 and increased $45 million in 2010. Revenues associated with certain tracking
mechanisms and surcharges are offset by related expenses elsewhere in the Consolidated Statement of Operations.
Uncollectible tracking mechanism
2010 self-implementation and rate order
Revenue decoupling mechanism
Energy optimization performance incentive
Midstream storage and transportation revenues
Subsidiaries transferred to an affiliate
Weather
Lost and stolen gas
Other
Increase (decrease) in gross margin
2011
(In millions)
$(27)
(4)
5
7
(12)
(17)
25
—
4
$(19)
2010
$(43)
125
—
—
(20)
—
(23)
13
(7)
$ 45
Gas Markets (in Bcf)
Gas sales
End user transportation
Intermediate transportation
2011
120
141
261
273
534
2010
116
140
256
391
647
2009
135
124
259
462
721
Operation and maintenance expense increased $17 million in 2011 and decreased $38 million in 2010. The increase in 2011 is
primarily due to the 2010 deferral of $32 million of previously expensed CTA restructuring expenses and increased energy
optimization expenses of $10 million, partially offset by reduced uncollectible expenses of $13 million, reduced expenses for
subsidiaries transferred to an affiliate of $6 million, lower customer service expenses of $5 million, and lower gas operations
expenses of $4 million. The decrease in 2010 is primarily due to reduced uncollectible expenses of $35 million and the deferral
of $32 million of previously expensed CTA restructuring expenses, partially offset by higher maintenance expenses of
$11 million, increased energy optimization expenses of $9 million, higher employee benefit-related expenses of $3 million and
contributions of $3 million to the Low Income Energy Efficiency Fund.