DTE Energy 2011 Annual Report Download - page 34
Download and view the complete annual report
Please find page 34 of the 2011 DTE Energy annual report below. You can navigate through the pages in the report by either clicking on the pages listed below, or by using the keyword search tool below to find specific information within the annual report.-
 1
1 -
2
-
3
-
4
-
5
-
6
-
7
-
8
-
9
-
10
-
11
-
12
-
13
-
14
-
15
-
16
-
17
-
18
-
19
-
20
-
21
-
22
-
23
-
 24
24 -
 25
25 -
 26
26 -
 27
27 -
 28
28 -
 29
29 -
 30
30 -
 31
31 -
 32
32 -
 33
33 -
 34
34 -
 35
35 -
 36
36 -
 37
37 -
 38
38
 |
 |

32
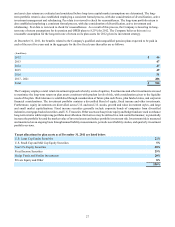
At December 31, 2011, the benefits expected to be paid, including prescription drug benefits, in each of the next five years and
in the aggregate for the five fiscal years thereafter are as follows:
(in Millions)
2012
2013
2014
2015
2016
2017 - 2021
Total
$ 26
27
28
30
33
191
$ 335
The process used in determining the long-term rate of return for assets and the investment approach for our other postretirement
benefits plans is similar to those previously described for our pension plans.
Target allocations for plan assets as of December 31, 2011 are listed below:
U.S. Equity Securities
Non U.S. Equity Securities
Fixed Income Securities
Hedge Funds and Similar Investments
Private Equity and Other
22%
20%
25%
20%
13%
100%
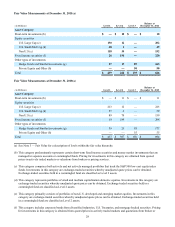
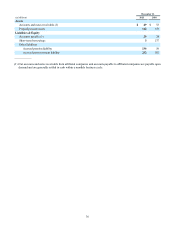
Fair Value Measurements at December 31, 2011(a)
(in Millions)
Asset Category:
Short-term investments (b)
Equity securities
U.S. Large Cap (c)
U.S. Small/Mid Cap (d)
Non U.S (e)
Fixed income securities (f)
Other types of investments
Hedge Funds and Similar Investments (g)
Private Equity and Other (h)
Total
Level 1
$ —
59
24
59
8
27
—
$ 177
Level 2
$ 4
5
2
5
80
7
—
$ 103
Level 3
$ —
—
—
—
—
32
20
$ 52
Balance at
December 31, 2011
$ 4
64
26
64
88
66
20
$ 332