DTE Energy 2012 Annual Report Download - page 104
Download and view the complete annual report
Please find page 104 of the 2012 DTE Energy annual report below. You can navigate through the pages in the report by either clicking on the pages listed below, or by using the keyword search tool below to find specific information within the annual report.-
 1
1 -
2
-
3
-
4
-
5
-
6
-
7
-
8
-
9
-
10
-
11
-
12
-
13
-
14
-
15
-
16
-
17
-
18
-
19
-
20
-
21
-
22
-
23
-
24
-
25
-
26
-
27
-
28
-
29
-
30
-
31
-
32
-
33
-
34
-
35
-
36
-
37
-
38
-
39
-
40
-
41
-
42
-
43
-
44
-
45
-
46
-
47
-
48
-
49
-
50
-
51
-
52
-
53
-
54
-
55
-
56
-
57
-
58
-
59
-
60
-
61
-
62
-
63
-
64
-
65
-
66
-
67
-
68
-
69
-
70
-
71
-
72
-
73
-
74
-
75
-
76
-
77
-
78
-
79
-
80
-
81
-
82
-
83
-
84
-
85
-
86
-
87
-
88
-
89
-
90
-
91
-
92
-
93
-
 94
94 -
 95
95 -
 96
96 -
 97
97 -
 98
98 -
 99
99 -
 100
100 -
 101
101 -
 102
102 -
 103
103 -
 104
104 -
 105
105 -
 106
106 -
 107
107 -
 108
108 -
 109
109 -
 110
110 -
 111
111 -
 112
112 -
 113
113 -
 114
114 -
115
-
116
-
117
-
118
-
119
-
120
-
121
-
122
-
123
-
124
-
125
-
126
-
127
-
128
-
129
-
130
-
131
-
132
-
133
-
134
-
135
-
136
-
137
-
138
-
139
-
140
-
141
-
142
-
143
-
144
-
145
-
146
-
147
-
148
-
149
-
150
 |
 |

Table of Contents
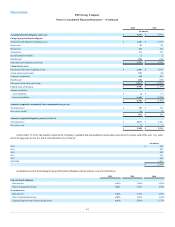
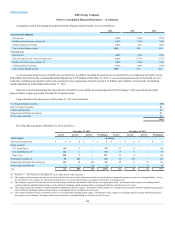
Assumptions used in determining the projected benefit obligation and net benefit costs are listed below:
Discount rate
5.00%
5.50%
Health care trend rate pre- and post- 65
7.00%
7.00%
Ultimate health care trend rate
5.00%
5.00%
Year in which ultimate reached
2016
2016
Discount rate
5.50%
5.90%
Expected long-term rate of return on plan assets
8.75%
8.75%
Health care trend rate pre- and post- 65
7.00%
7.00%
Ultimate health care trend rate
5.00%
5.00%
Year in which ultimate reached
2019
2016
A one percentage point increase in health care cost trend rates would have increased the total service cost and interest cost components of benefit costs by
$28 million and increased the accumulated benefit obligation by $ 279 million at December 31, 2012. A one percentage point decrease in the health care cost
trend rates would have decreased the total service and interest cost components of benefit costs by $ 19 million and would have decreased the accumulated
benefit obligation by $264 million at December 31, 2012.
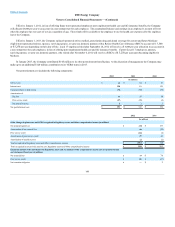
The process used in determining the long-term rate of return for assets and the investment approach for the Company’s other postretirement benefits
plans is similar to those previously described for its pension plans.
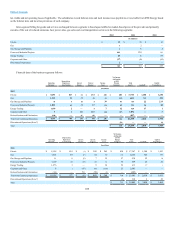
Target allocations for plan assets as of December 31, 2012 are listed below:
U.S. Domestic Equity Securities
Non U.S. Equity Securities
Fixed Income Securities
Hedge Funds and Similar Investments
Private Equity and Other
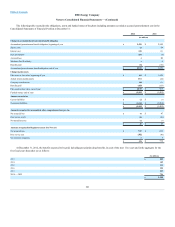
Fair Value Measurements at December 31, 2012 and 2011(a):
Short-term investments (b)
$ —
$13
$ —
$13
Equity securities:
U.S. Large Cap (c)
175
15
—
190
U.S. Small/Mid Cap (d)
70
6
—
76
Non U.S (e)
176
14
—
190
Fixed income securities (f)
24
236
—
260
Hedge Funds and Similar Investments (g)
80
21
95
196
Private Equity and Other (h)
—
—
60
60
Total
$ 525
$305
$155
$985
_______________________________________
(a) See Note 3 — Fair Value for a description of levels within the fair value hierarchy.
(b) This category predominantly represents certain short-term fixed income securities and money market investments that are managed in separate accounts or commingled funds. Pricing
for investments in this category are obtained from quoted prices in actively traded markets or valuations from brokers or pricing services.
(c) This category comprises both actively and not actively managed portfolios that track the S&P 500 low cost equity index funds. Investments in this category are exchange-traded
securities whereby unadjusted quote prices can be obtained. Exchange-traded securities held in a commingled fund are classified as Level 2 assets.
(d) This category represents portfolios of small and medium capitalization domestic equities. Investments in this category are exchange-traded securities whereby unadjusted quote prices
can be obtained. Exchange-traded securities held in a commingled fund are classified as Level 2 assets.
(e) This category primarily consists of portfolios of non-U.S. developed and emerging market equities. Investments in this category are exchange-traded securities whereby unadjusted
quote prices can be obtained. Exchange-traded securities held in a commingled fund are classified as Level 2 assets.
102