DTE Energy 2012 Annual Report Download - page 68
Download and view the complete annual report
Please find page 68 of the 2012 DTE Energy annual report below. You can navigate through the pages in the report by either clicking on the pages listed below, or by using the keyword search tool below to find specific information within the annual report.-
 1
1 -
2
-
3
-
4
-
5
-
6
-
7
-
8
-
9
-
10
-
11
-
12
-
13
-
14
-
15
-
16
-
17
-
18
-
19
-
20
-
21
-
22
-
23
-
24
-
25
-
26
-
27
-
28
-
29
-
30
-
31
-
32
-
33
-
34
-
35
-
36
-
37
-
38
-
39
-
40
-
41
-
42
-
43
-
44
-
45
-
46
-
47
-
48
-
49
-
50
-
51
-
52
-
53
-
54
-
55
-
56
-
57
-
 58
58 -
 59
59 -
 60
60 -
 61
61 -
 62
62 -
 63
63 -
 64
64 -
 65
65 -
 66
66 -
 67
67 -
 68
68 -
 69
69 -
 70
70 -
 71
71 -
 72
72 -
 73
73 -
 74
74 -
 75
75 -
 76
76 -
 77
77 -
 78
78 -
79
-
80
-
81
-
82
-
83
-
84
-
85
-
86
-
87
-
88
-
89
-
90
-
91
-
92
-
93
-
94
-
95
-
96
-
97
-
98
-
99
-
100
-
101
-
102
-
103
-
104
-
105
-
106
-
107
-
108
-
109
-
110
-
111
-
112
-
113
-
114
-
115
-
116
-
117
-
118
-
119
-
120
-
121
-
122
-
123
-
124
-
125
-
126
-
127
-
128
-
129
-
130
-
131
-
132
-
133
-
134
-
135
-
136
-
137
-
138
-
139
-
140
-
141
-
142
-
143
-
144
-
145
-
146
-
147
-
148
-
149
-
150
 |
 |

Table of Contents
period. The following table shows transfers between the levels of the fair value hierarchy for the years ended December 31, 2012 and 2011:
Year Ended December 31, 2011
Level 1
Level 2
Level 3
Transfers into Level 1 from
N/A
$ —
$ —
Transfers into Level 2 from
$ —
N/A
24
Transfers into Level 3 from
—
4
N/A
The following table presents the unobservable inputs related to Level 3 assets and liabilities as of December 31, 2012:
Natural Gas
Electricity
The unobservable inputs used in the fair value measurement of the electricity and natural gas commodity types consists of inputs that are less
observable due in part to lack of available broker quotes, supported by little, if any, market activity at the measurement date or are based on internally
developed models. Certain forward market and/or basis prices (i.e., the difference in pricing between two locations) that were included in the valuation of
natural gas and electricity contracts were deemed unobservable.
The inputs listed above would have a direct impact on the fair values of the above security types if they were adjusted. A significant increase (decrease)
in the forward market or basis price would result in a higher (lower) fair value for long positions, with offsetting impacts to short positions.
Fair Value of Financial Instruments
The fair value of financial instruments included in the table below is determined by using quoted market prices when available. When quoted prices are
not available, pricing services may be used to determine the fair value with reference to observable interest rate indexes. DTE Energy has obtained an
understanding of how the fair values are derived. DTE Energy also selectively corroborates the fair value of its transactions by comparison of market-based
price sources. Discounted cash flow analyses based upon estimated current borrowing rates are also used to determine fair value when quoted market prices
are not available. The fair values of notes receivable, excluding capital leases, are estimated using discounted cash flow techniques that incorporate market
interest rates as well assumptions about the remaining life of the loans and credit risk. Depending on the information available, other valuation techniques may
be used that rely on internal assumptions and models. Valuation policies and procedures are determined by DTE Energy's Treasury Department which reports
to the Company's Vice President and Treasurer.
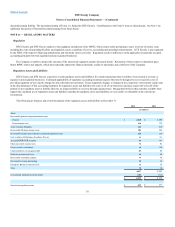
The following table presents the carrying amount and fair value of financial instruments as of December 31, 2012 and 2011:
Notes receivable, excluding capital leases
$48
$48
Dividends payable
99
99
Short-term borrowings
419
419
Long-term debt
7,682
8,757
66