DTE Energy 2012 Annual Report Download - page 75
Download and view the complete annual report
Please find page 75 of the 2012 DTE Energy annual report below. You can navigate through the pages in the report by either clicking on the pages listed below, or by using the keyword search tool below to find specific information within the annual report.-
 1
1 -
2
-
3
-
4
-
5
-
6
-
7
-
8
-
9
-
10
-
11
-
12
-
13
-
14
-
15
-
16
-
17
-
18
-
19
-
20
-
21
-
22
-
23
-
24
-
25
-
26
-
27
-
28
-
29
-
30
-
31
-
32
-
33
-
34
-
35
-
36
-
37
-
38
-
39
-
40
-
41
-
42
-
43
-
44
-
45
-
46
-
47
-
48
-
49
-
50
-
51
-
52
-
53
-
54
-
55
-
56
-
57
-
58
-
59
-
60
-
61
-
62
-
63
-
64
-
 65
65 -
 66
66 -
 67
67 -
 68
68 -
 69
69 -
 70
70 -
 71
71 -
 72
72 -
 73
73 -
 74
74 -
 75
75 -
 76
76 -
 77
77 -
 78
78 -
 79
79 -
 80
80 -
 81
81 -
 82
82 -
 83
83 -
 84
84 -
 85
85 -
86
-
87
-
88
-
89
-
90
-
91
-
92
-
93
-
94
-
95
-
96
-
97
-
98
-
99
-
100
-
101
-
102
-
103
-
104
-
105
-
106
-
107
-
108
-
109
-
110
-
111
-
112
-
113
-
114
-
115
-
116
-
117
-
118
-
119
-
120
-
121
-
122
-
123
-
124
-
125
-
126
-
127
-
128
-
129
-
130
-
131
-
132
-
133
-
134
-
135
-
136
-
137
-
138
-
139
-
140
-
141
-
142
-
143
-
144
-
145
-
146
-
147
-
148
-
149
-
150
 |
 |

Table of Contents
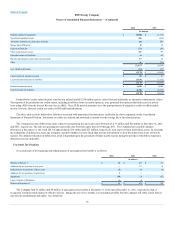
Operating Revenues $ 55
$ 39
$ 32
Operation and Maintenance 24
16
11
Depreciation, Depletion and Amortization 23
18
15
Taxes Other than Income 4
3
2
Asset (Gains) and Losses, Net 83
—
10
134
37
38
Operating Income (79)
2
(6)
Other (Income) and Deductions 6
6
6
Loss Before Income Taxes (85)
(4)
(12)
Income Tax Benefit (29)
(1)
(4)
Net Loss $(56)
$(3)
$(8)
Summary of property by classification as of December 31:
Electric
Generation
$9,785
Distribution
7,003
Total Electric
16,788
Gas
Distribution
2,561
Storage
406
Other
902
Total Gas
3,869
Non-utility and other
1,884
Total
22,541
Electric
Generation
(3,946)
Distribution
(2,580)
Total Electric
(6,526)
Gas
Distribution
(1,041)
Storage
(127)
Other
(413)
Total Gas
(1,581)
Non-utility and other
(688)
Total
(8,795)
$13,746
The Allowance for Funds used During Construction (AFUDC) capitalized was approximately $20 million and $10 million during 2012 and 2011,
respectively.
The composite depreciation rate for DTE Electric was approximately 3.3% in 2012, 2011 and 2010. The composite depreciation rate for DTE Gas was
2.4% in 2012, 2.3% in 2011 and 2.5% in 2010.
73