DTE Energy 2012 Annual Report Download - page 36
Download and view the complete annual report
Please find page 36 of the 2012 DTE Energy annual report below. You can navigate through the pages in the report by either clicking on the pages listed below, or by using the keyword search tool below to find specific information within the annual report.-
 1
1 -
2
-
3
-
4
-
5
-
6
-
7
-
8
-
9
-
10
-
11
-
12
-
13
-
14
-
15
-
16
-
17
-
18
-
19
-
20
-
21
-
22
-
23
-
24
-
25
-
 26
26 -
 27
27 -
 28
28 -
 29
29 -
 30
30 -
 31
31 -
 32
32 -
 33
33 -
 34
34 -
 35
35 -
 36
36 -
 37
37 -
 38
38 -
 39
39 -
 40
40 -
 41
41 -
 42
42 -
 43
43 -
 44
44 -
 45
45 -
 46
46 -
47
-
48
-
49
-
50
-
51
-
52
-
53
-
54
-
55
-
56
-
57
-
58
-
59
-
60
-
61
-
62
-
63
-
64
-
65
-
66
-
67
-
68
-
69
-
70
-
71
-
72
-
73
-
74
-
75
-
76
-
77
-
78
-
79
-
80
-
81
-
82
-
83
-
84
-
85
-
86
-
87
-
88
-
89
-
90
-
91
-
92
-
93
-
94
-
95
-
96
-
97
-
98
-
99
-
100
-
101
-
102
-
103
-
104
-
105
-
106
-
107
-
108
-
109
-
110
-
111
-
112
-
113
-
114
-
115
-
116
-
117
-
118
-
119
-
120
-
121
-
122
-
123
-
124
-
125
-
126
-
127
-
128
-
129
-
130
-
131
-
132
-
133
-
134
-
135
-
136
-
137
-
138
-
139
-
140
-
141
-
142
-
143
-
144
-
145
-
146
-
147
-
148
-
149
-
150
 |
 |

Table of Contents
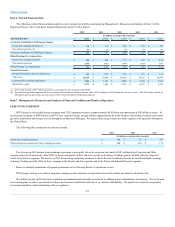
ENERGY TRADING
Energy Trading focuses on physical and financial power, gas and coal marketing and trading, structured transactions, enhancement of returns from
DTE Energy’s asset portfolio, and optimization of contracted natural gas pipeline transportation and storage, and generating capacity positions. Energy
Trading also provides natural gas, power and related services, and the supply or purchase of renewable energy credits to various customers which may
include the management of associated storage and transportation contracts on the customers’ behalf.
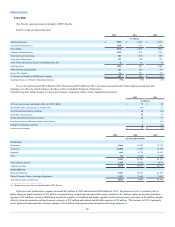
Energy Trading results are discussed below:
Operating Revenues
$1,276
$875
Fuel, Purchased Power and Gas
1,112
786
Gross Margin
164
89
Operation and Maintenance
63
59
Depreciation and Amortization
3
5
Taxes Other Than Income
3
2
Operating Income
95
23
Other (Income) and Deductions
9
12
Income Tax Expense
34
5
Net Income Attributable to DTE Energy Company
$ 52
$ 6
Gross margin decreased $66 million in 2012 and increased $75 million in 2011. The overall decrease in gross margin in 2012 was the result of
decreased economic performance in our power and gas trading and power full requirements services strategies due to fewer market opportunities.
The decrease in 2012 represents a $28 million decrease in realized margins and a $38 million decrease in unrealized margins. The $28 million decrease
in realized margins is due to $74 million of unfavorable results, primarily in our power and gas trading and power full requirements services strategies, offset
by $46 million of favorable results, primarily in our gas full requirements services, gas structured, and gas transportation strategies. The $38 million
decrease in unrealized margins is due to $58 million of unfavorable results, primarily in our power and gas full requirements services, power trading, and gas
structured and storage strategies, offset by $20 million of favorable results, primarily in our gas trading strategy.
The increase in 2011 represents a $25 million increase in realized margins and $50 million increase in unrealized margins. The $25 million increase in
realized margins is due to $73 million of favorable results, primarily in our power and gas trading and power full requirements services strategies, offset by
$48 million of unfavorable results, primarily in our power origination, gas structured and gas full requirements services strategies. The $50 million increase
in unrealized margins is due to $63 million of favorable results, primarily in our power full requirements services, gas structured and gas trading strategies,
offset by $13 million of unfavorable results, primarily in our power transmission strategy.
Outlook - In the near term, we expect market conditions to remain challenging and the profitability of this segment may be impacted by the volatility or
lack thereof in commodity prices in the markets we participate in and the uncertainty of impacts associated with financial reform, regulatory changes and
changes in operating rules of regional transmission organizations.
The Energy Trading portfolio includes financial instruments, physical commodity contracts and gas inventory, as well as contracted natural gas
pipeline transportation and storage, and generation capacity positions. Energy Trading also provides natural gas, power and related services, which may
include the management of associated storage and transportation contracts on the customers' behalf under FERC Asset Management Arrangements, and the
supply or purchase of renewable energy credits to various customers. Significant portions of the Energy Trading portfolio are economically hedged. Most
financial instruments and physical power and gas contracts are deemed derivatives, whereas natural gas inventory, pipeline transportation, renewable energy
credits, and storage assets are not derivatives. As a result, we will experience earnings volatility as derivatives are marked-to-market without revaluing the
underlying non-derivative contracts and assets. Our strategy is to economically manage the price risk of these underlying non-derivative contracts and assets
with futures, forwards, swaps and options. This results in gains and losses that are recognized in different interim and annual accounting periods.
See also the “Fair Value” section that follows.
34