DTE Energy 2012 Annual Report Download - page 99
Download and view the complete annual report
Please find page 99 of the 2012 DTE Energy annual report below. You can navigate through the pages in the report by either clicking on the pages listed below, or by using the keyword search tool below to find specific information within the annual report.-
 1
1 -
2
-
3
-
4
-
5
-
6
-
7
-
8
-
9
-
10
-
11
-
12
-
13
-
14
-
15
-
16
-
17
-
18
-
19
-
20
-
21
-
22
-
23
-
24
-
25
-
26
-
27
-
28
-
29
-
30
-
31
-
32
-
33
-
34
-
35
-
36
-
37
-
38
-
39
-
40
-
41
-
42
-
43
-
44
-
45
-
46
-
47
-
48
-
49
-
50
-
51
-
52
-
53
-
54
-
55
-
56
-
57
-
58
-
59
-
60
-
61
-
62
-
63
-
64
-
65
-
66
-
67
-
68
-
69
-
70
-
71
-
72
-
73
-
74
-
75
-
76
-
77
-
78
-
79
-
80
-
81
-
82
-
83
-
84
-
85
-
86
-
87
-
88
-
 89
89 -
 90
90 -
 91
91 -
 92
92 -
 93
93 -
 94
94 -
 95
95 -
 96
96 -
 97
97 -
 98
98 -
 99
99 -
 100
100 -
 101
101 -
 102
102 -
 103
103 -
 104
104 -
 105
105 -
 106
106 -
 107
107 -
 108
108 -
 109
109 -
110
-
111
-
112
-
113
-
114
-
115
-
116
-
117
-
118
-
119
-
120
-
121
-
122
-
123
-
124
-
125
-
126
-
127
-
128
-
129
-
130
-
131
-
132
-
133
-
134
-
135
-
136
-
137
-
138
-
139
-
140
-
141
-
142
-
143
-
144
-
145
-
146
-
147
-
148
-
149
-
150
 |
 |

Table of Contents
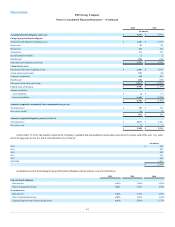
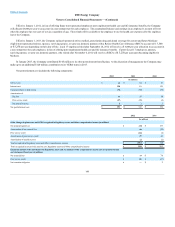
$3,881
Projected benefit obligation, beginning of year
$3,785
Service cost
69
Interest cost
202
Actuarial loss
355
Special termination benefits
2
Benefits paid
(218)
Projected benefit obligation, end of year
$4,195
Plan assets at fair value, beginning of year
$2,913
Actual return on plan assets
(18)
Company contributions
209
Benefits paid
(218)
Plan assets at fair value, end of year
$2,886
Funded status of the plans
$(1,309)
Amount recorded as:
Current liabilities
$(11)
Noncurrent liabilities
(1,298)
$(1,309)
Net actuarial loss
$202
Prior service (credit)
(3)
$199
Net actuarial loss
$2,201
Prior service cost
7
$2,208
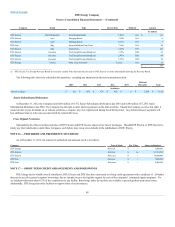
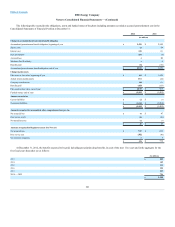
At December 31, 2012, the benefits related to the Company’s qualified and nonqualified pension plans expected to be paid in each of the next five years
and in the aggregate for the five fiscal years thereafter are as follows:
2013 $ 236
2014 242
2015 252
2016 260
2017 269
2018-2022 1,485
$2,744
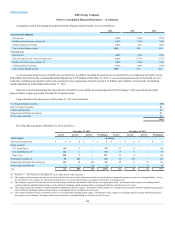
Assumptions used in determining the projected benefit obligation and net pension costs are listed below:
Discount rate
5.00%
5.50%
Rate of compensation increase
4.20%
4.00%
Discount rate
5.50%
5.90%
Rate of compensation increase
4.00%
4.00%
Expected long-term rate of return on plan assets
8.50%
8.75%
97