DTE Energy 2012 Annual Report Download - page 38
Download and view the complete annual report
Please find page 38 of the 2012 DTE Energy annual report below. You can navigate through the pages in the report by either clicking on the pages listed below, or by using the keyword search tool below to find specific information within the annual report.-
 1
1 -
2
-
3
-
4
-
5
-
6
-
7
-
8
-
9
-
10
-
11
-
12
-
13
-
14
-
15
-
16
-
17
-
18
-
19
-
20
-
21
-
22
-
23
-
24
-
25
-
26
-
27
-
 28
28 -
 29
29 -
 30
30 -
 31
31 -
 32
32 -
 33
33 -
 34
34 -
 35
35 -
 36
36 -
 37
37 -
 38
38 -
 39
39 -
 40
40 -
 41
41 -
 42
42 -
 43
43 -
 44
44 -
 45
45 -
 46
46 -
 47
47 -
 48
48 -
49
-
50
-
51
-
52
-
53
-
54
-
55
-
56
-
57
-
58
-
59
-
60
-
61
-
62
-
63
-
64
-
65
-
66
-
67
-
68
-
69
-
70
-
71
-
72
-
73
-
74
-
75
-
76
-
77
-
78
-
79
-
80
-
81
-
82
-
83
-
84
-
85
-
86
-
87
-
88
-
89
-
90
-
91
-
92
-
93
-
94
-
95
-
96
-
97
-
98
-
99
-
100
-
101
-
102
-
103
-
104
-
105
-
106
-
107
-
108
-
109
-
110
-
111
-
112
-
113
-
114
-
115
-
116
-
117
-
118
-
119
-
120
-
121
-
122
-
123
-
124
-
125
-
126
-
127
-
128
-
129
-
130
-
131
-
132
-
133
-
134
-
135
-
136
-
137
-
138
-
139
-
140
-
141
-
142
-
143
-
144
-
145
-
146
-
147
-
148
-
149
-
150
 |
 |

Table of Contents
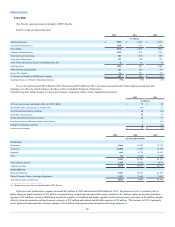
Cash Flow From (Used For)
Operating activities:
Net income
$720
$ 639
Depreciation, depletion and amortization
995
1,027
Deferred income taxes
220
457
Loss on sale of non-utility business
—
—
Asset (gains) and losses, reserves and impairments, net
(21)
(5)
Working capital and other
94
(293)
2,008
1,825
Investing activities:
Plant and equipment expenditures — utility
(1,382)
(1,011)
Plant and equipment expenditures — non-utility
(102)
(88)
Proceeds from sale of non-utility business
—
—
Proceeds from sale of assets
18
56
Acquisition, net of cash acquired
—
—
Other
(94)
(183)
(1,560)
(1,226)
Financing activities:
Issuance of long-term debt
1,179
614
Redemption of long-term debt
(1,455)
(663)
Short-term borrowings, net
269
(177)
Issuance of common stock
—
36
Repurchase of common stock
(18)
—
Dividends on common stock
(389)
(360)
Other
(31)
(36)
(445)
(586)
Net Increase (Decrease) in Cash and Cash Equivalents
$ 3
$13
Cash from Operating Activities
A majority of our operating cash flow is provided by our electric and gas utilities, which are significantly influenced by factors such as weather, electric
Customer Choice, regulatory deferrals, regulatory outcomes, economic conditions and operating costs.
Cash from operations totaling $2.2 billion in 2012 was $201 million higher than the comparable 2011 period. The operating cash flow comparison
primarily reflects cash generated from working capital items, partially offset by lower net income after adjusting for non-cash and non-operating items
(depreciation, depletion and amortization, deferred income taxes, loss on sale of non-utility business and asset (gains) and losses, reserves and impairments,
net).
Cash from operations totaling $2 billion in 2011 was $183 million higher than the comparable 2010 period. The operating cash flow comparison
primarily reflects cash generated from working capital items, partially offset by lower net income after adjusting for non-cash and non-operating items
(depreciation, depletion and amortization, deferred income taxes and asset (gains) and losses, reserves and impairments, net).
The changes in working capital items in both years primarily relate to pension and postretirement obligations and income tax items.
Cash from Investing Activities
Cash inflows associated with investing activities are primarily generated from the sale of assets, while cash outflows are the result of plant and
equipment expenditures. In any given year, we will look to realize cash from under-performing or non-strategic assets or matured fully valued assets.
Capital spending within the utility business is primarily to maintain and improve our electric generation and electric and gas distribution infrastructure
and to comply with environmental regulations and renewable energy requirements.
36