Electronic Arts 2002 Annual Report Download - page 21
Download and view the complete annual report
Please find page 21 of the 2002 Electronic Arts annual report below. You can navigate through the pages in the report by either clicking on the pages listed below, or by using the keyword search tool below to find specific information within the annual report.-
 1
1 -
2
-
3
-
4
-
5
-
6
-
7
-
8
-
9
-
10
-
 11
11 -
 12
12 -
 13
13 -
 14
14 -
 15
15 -
 16
16 -
 17
17 -
 18
18 -
 19
19 -
 20
20 -
 21
21 -
 22
22 -
 23
23 -
 24
24 -
 25
25 -
 26
26 -
 27
27 -
 28
28 -
 29
29 -
 30
30 -
 31
31 -
32
-
33
-
34
-
35
-
36
-
37
-
38
-
39
-
40
-
41
-
42
-
43
-
44
-
45
-
46
-
47
-
48
-
49
-
50
-
51
-
52
-
53
-
54
-
55
-
56
-
57
-
58
-
59
-
60
-
61
-
62
-
63
-
64
-
65
-
66
-
67
-
68
-
69
-
70
-
71
-
72
-
73
-
74
 |
 |

RESULTS OF OPERATIONS
Comparison of Fiscal 2002 to 2001:
REVENUES
We derive revenues primarily from shipments of entertainment software, which includes EA Studio products
for dedicated entertainment systems (that we call video game systems or consoles such as PlayStation,
PlayStation 2, Xbox and Nintendo GameCube, and handheld systems such as Game Boy®Advance), EA Studio
personal computer products (or PC), Co-Publishing products that are co-published and distributed by us,
and Affiliated Label (or AL) products that are published by third parties and distributed by us.We also
derive revenues from licensing of EA Studio products and AL products through hardware companies (or
OEM), selling subscriptions on our online gaming service, selling advertisements on our online web pages
and selling our packaged goods through our online store.
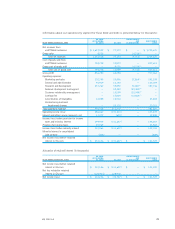
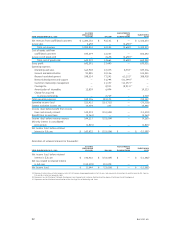
Information about our net revenues for North America and foreign areas for fiscal 2002 and 2001 is sum-
marized below (in thousands):
2002 2001 INCREASE % CHANGE
North America $1,093,244 $831,924 $ 261,320 31.4 %
Europe 519,458 386,728 132,730 34.3 %
Asia Pacific 53,376 51,039 2,337 4.6 %
Japan 58,597 52,582 6,015 11.4 %
International 631,431 490,349 141,082 28.8 %
Consolidated Net Revenues $1,724,675 $1,322,273 $ 402,402 30.4 %
North America Net Revenues
The increase in North America net revenues for fiscal 2002 compared to fiscal 2001 was primarily attrib-
utable to:
|•••»A 111% increase in PlayStation 2 revenues for the year due to the shipment of key titles such as
Madden
NFL 2002
,
James Bond 007 in…Agent Under Fire
,
NBA Street
,
NBA Live 2002
and
SSX Tricky
,a
higher installed base of hardware and a strong catalogue business. PlayStation 2 launched in October
2000. Consequently, fiscal 2001 includes six months of revenues as compared to twelve months of rev-
enues for the PlayStation 2 in fiscal 2002.
|•••»The launch of the Xbox platform in North America in November 2001, which generated $73,609,000
in revenues from titles such as
Madden NFL 2002
,
NBA Live 2002
,
James Bond 007 in...Agent Under
Fire
,
NASCAR Thunder™2002
,
NHL 2002
and
SSX Tricky
.
|•••»The launch of Nintendo GameCube in North America in November 2001, which generated $48,744,000
for the year from key titles such as
Madden NFL 2002
,
James Bond 007 in... Agent Under Fire
,
SSX
Tricky
,
NBA Street
and
FIFA Soccer 2002
.
|•••»New revenues were generated by Game Boy Advance of $25,989,000 for the year from key titles
including
Harry Potter and the Sorcerer’s Stone
,
Madden NFL
2002 and
NHL 2002
.Also, Game Boy
Color generated new revenues of $16,870,000 for the year from titles such as
Harry Potter and the Sor-
cerer’s Stone
,
Madden NFL 2002
and
The World Is Not Enough
.
|•••»Advertising revenues increased by $31,849,000 for the twelve months ended March 31, 2002 as we
commenced generating advertising revenues immediately following the launch of our gamesite on the
world wide web in October 2000. In addition, advertising revenues were generated from Pogo Corpora-
tion’s (“Pogo”) websites subsequent to the February 2001 acquisition.
|•••»These increases were partially offset by the continued expected decreases in Sony PlayStation and
Nintendo 64®(“N64”) revenues due to those declining markets and fewer titles shipping compared to
the same period in the prior year.
17
EA 2002 AR