Electronic Arts 2002 Annual Report Download - page 36
Download and view the complete annual report
Please find page 36 of the 2002 Electronic Arts annual report below. You can navigate through the pages in the report by either clicking on the pages listed below, or by using the keyword search tool below to find specific information within the annual report.-
 1
1 -
2
-
3
-
4
-
5
-
6
-
7
-
8
-
9
-
10
-
11
-
12
-
13
-
14
-
15
-
16
-
17
-
18
-
19
-
20
-
21
-
22
-
23
-
24
-
25
-
 26
26 -
 27
27 -
 28
28 -
 29
29 -
 30
30 -
 31
31 -
 32
32 -
 33
33 -
 34
34 -
 35
35 -
 36
36 -
 37
37 -
 38
38 -
 39
39 -
 40
40 -
 41
41 -
 42
42 -
 43
43 -
 44
44 -
 45
45 -
 46
46 -
47
-
48
-
49
-
50
-
51
-
52
-
53
-
54
-
55
-
56
-
57
-
58
-
59
-
60
-
61
-
62
-
63
-
64
-
65
-
66
-
67
-
68
-
69
-
70
-
71
-
72
-
73
-
74
 |
 |

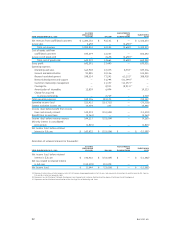
The following table shows our pro forma results reconciled to the GAAP Consolidated Statements of Opera-
tions. Our pro forma results do not include unusual events or transactions, such as restructuring and asset
impairment costs and charge for acquired in-process technology, and also excludes amortization of intangi-
bles and non-cash stock compensation charges. In addition, income taxes are allocated to EA Core and
EA.com at the consolidated effective tax rate (31%) on a pro rata basis.We believe the disclosure of the
pro forma net income (loss) and operating profit (loss), which excludes the items noted in the table below,
helps investors more meaningfully evaluate the results of our ongoing operations. However,we urge investors
to carefully review the GAAP financial information included as part of this Annual Report and compare
GAAP financial information with the pro forma financial results disclosed in this Annual Report.
Reconciliation of GAAP to Pro Forma net income (loss) (in thousands):
FISCAL YEAR ENDED MARCH 31, 2001 MARCH 31, 2000
EA CORE EA CORE
(EXCLUDING ELECTRONIC (EXCLUDING ELECTRONIC
EA.COM) EA.COM ARTS EA.COM) EA.COM ARTS
Net income (loss) - GAAP $ 11,944 $ (23,026) $ (11,082) $ 116,751 $ – $ 116,751
Net loss related to retained
interest in EA.com (note 1) 130,478 (130,478) – 54,590 (54,590) –
Pro forma allocation of
income taxes (note 2) (47,586) 47,586 – (16,923) 16,923 –
Pro forma net income (loss) 94,836 (105,918) (11,082) 154,418 (37,667) 116,751
Amortization of intangibles 12,829 6,494 19,323 10,866 1,123 11,989
Charge for acquired
in-process technology – 2,719 2,719 2,670 3,869 6,539
Non-cash stock compensation
for non-employees (note 3) 2,479 228 2,707 736 – 736
Income tax effect on the
above items (4,745) (2,927) (7,672) (4,424) (1,548) (5,972)
Pro forma net income (loss)
excluding the items above $ 105,399 $ (99,404) $ 5,995 $ 164,266 $ (34,223) $ 130,043
1) EA Core maintains approximately 85% retained interest in EA.com and is reflected in the Net income - GAAP for EA Core.The pro forma statements
exclude the retained interest allocation.
2) The provision for income taxes was allocated between EA Core and EA.com at the worldwide effective tax rate (31%) based on each segment's pro rata
share of income or loss.The sum of tax provision for EA Core and EA.com is the same as consolidated tax provision.
3) Total non-cash stock compensation charges are included in Research and Development in GAAP financials, and excluded in the pro forma.
COSTS AND EXPENSES, INTEREST AND OTHER INCOME, NET, INCOME TAXES AND
NET INCOME (LOSS) FOR BOTH EA CORE AND EA.COM SEGMENTS
Cost of Goods Sold
% OF NET % OF NET
2001 REVENUES 2000 REVENUES % CHANGE
$652,242,000 49.3% $ 704,702,000 49.6% (7.4%)
Cost of goods sold as a percentage of revenues decreased in fiscal 2001 due to:
|•••»An increase in sales of higher margin PC titles as a percentage of revenues. Fiscal 2001 included sales
on titles such as
The Sims
,
Command & Conquer Red Alert 2
and
The Sims Livin’ Large
.
|•••»The introduction of higher margin PlayStation 2 products in fiscal 2001.
|•••»A decrease in sales of lower margin AL and N64 titles.
|•••»An increase in higher margin Online and Advertising revenue.
|•••»Offset by a decrease in sales of PlayStation titles combined with the decrease in average margins on
PlayStation products due to a decrease in the average sales price on front line and catalog products.
EA 2002 AR
32